GBP/USD Price Analysis: Volatility contracts amid quiet market mood, 1.1800 a key support


  • The formation of a symmetrical triangle indicates a consolidation ahead.
  • Overlapping short-to-medium-term EMAs signals a volatility contraction.
  • Quiet market mood is keeping the risk-perceived assets in a rangebound structure.

The GBP/USD pair turned sideways in the early Tokyo session after attempting a rebound below the critical support of 1.1800. The Cable is looking to extend its recovery above 1.1820 as risk-perceived currencies are gaining some traction in a quiet market mood.

Meanwhile, the US dollar index (DXY) is hovering around 107.80 after a bullish Monday. Apart from that, the 10-year US Treasury yields also rebounded to near 3.83% despite bleak chances of continuation of the 75 basis points (bps) rate hike structure by the Federal Reserve (Fed).

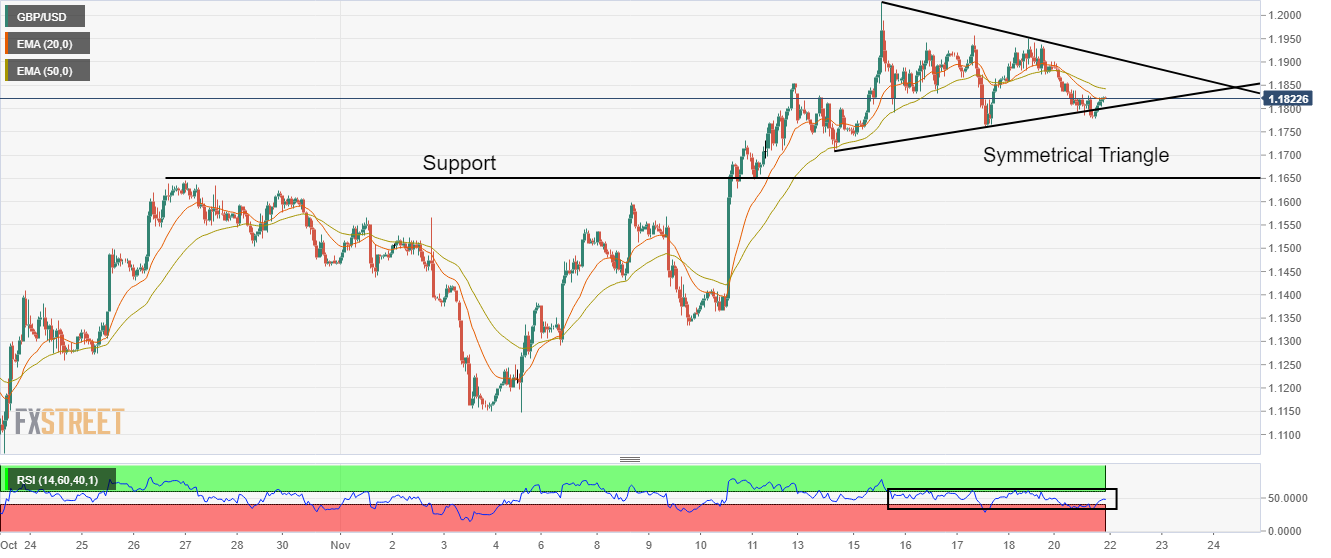
A formation of a Symmetrical Triangle on an hourly scale is indicating a volatility contraction. The upward-sloping trendline of the chart pattern is placed from November 14 low at 1.1710 while the downward-sloping trendline is plotted from November 15 high at 1.2029. A breakout of the same will result in wider ticks and heavy volume.

The 20-and 50-period Exponential Moving Averages (EMAs) are overlapping with each other, which signals a consolidation ahead.

Meanwhile, the Relative Strength Index (RSI) (14) has shifted into 40.00-60.00, which indicates the unavailability of a fresh trigger for decisive action ahead.

Going forward, a break above Friday’s high at 1.1950 will drive Cable towards November 15 high at 1.2029, followed by the round-level resistance at 1.2100.

On the flip side, a drop below Monday’s low at 1.1780 will drag the asset toward November 14 low at 1.1710. A slippage below November 14 low will expose the asset to the horizontal support plotted from October 27 high at 1.1646.

GBP/USD hourly chart

GBP/USD

Overview
Today last price 1.1822
Today Daily Change -0.0062
Today Daily Change % -0.52
Today daily open 1.1884
 
Trends
Daily SMA20 1.1584
Daily SMA50 1.137
Daily SMA100 1.1645
Daily SMA200 1.2224
 
Levels
Previous Daily High 1.1951
Previous Daily Low 1.1858
Previous Weekly High 1.2029
Previous Weekly Low 1.171
Previous Monthly High 1.1646
Previous Monthly Low 1.0924
Daily Fibonacci 38.2% 1.1915
Daily Fibonacci 61.8% 1.1893
Daily Pivot Point S1 1.1844
Daily Pivot Point S2 1.1805
Daily Pivot Point S3 1.1751
Daily Pivot Point R1 1.1937
Daily Pivot Point R2 1.199
Daily Pivot Point R3 1.203


Share: Feed news

Information on these pages contains forward-looking statements that involve risks and uncertainties. Markets and instruments profiled on this page are for informational purposes only and should not in any way come across as a recommendation to buy or sell in these assets. You should do your own thorough research before making any investment decisions. FXStreet does not in any way guarantee that this information is free from mistakes, errors, or material misstatements. It also does not guarantee that this information is of a timely nature. Investing in Open Markets involves a great deal of risk, including the loss of all or a portion of your investment, as well as emotional distress. All risks, losses and costs associated with investing, including total loss of principal, are your responsibility. The views and opinions expressed in this article are those of the authors and do not necessarily reflect the official policy or position of FXStreet nor its advertisers. The author will not be held responsible for information that is found at the end of links posted on this page.

If not otherwise explicitly mentioned in the body of the article, at the time of writing, the author has no position in any stock mentioned in this article and no business relationship with any company mentioned. The author has not received compensation for writing this article, other than from FXStreet.

FXStreet and the author do not provide personalized recommendations. The author makes no representations as to the accuracy, completeness, or suitability of this information. FXStreet and the author will not be liable for any errors, omissions or any losses, injuries or damages arising from this information and its display or use. Errors and omissions excepted.

The author and FXStreet are not registered investment advisors and nothing in this article is intended to be investment advice.

Recommended content


Recommended content

Editors’ Picks

AUD/USD keeps the red below 0.6400 as Middle East war fears mount

AUD/USD keeps the red below 0.6400 as Middle East war fears mount

AUD/USD is keeping heavy losses below 0.6400, as risk-aversion persists following the news that Israel retaliated with missile strikes on a site in Iran. Fears of the Israel-Iran strife translating into a wider regional conflict are weighing on the higher-yielding Aussie Dollar. 

AUD/USD News

USD/JPY recovers above 154.00 despite Israel-Iran escalation

USD/JPY recovers above 154.00 despite Israel-Iran escalation

USD/JPY is recovering ground above 154.00 after falling hard on confirmation of reports of an Israeli missile strike on Iran, implying that an open conflict is underway and could only spread into a wider Middle East war. Safe-haven Japanese Yen jumped, helped by BoJ Governor Ueda's comments. 

USD/JPY News

Gold price pares gains below $2,400, geopolitical risks lend support

Gold price pares gains below $2,400, geopolitical risks lend support

Gold price is paring gains to trade back below  $2,400 early Friday, Iran's downplaying of Israel's attack has paused the Gold price rally but the upside remains supported amid mounting fears over a potential wider Middle East regional conflict. 

Gold News

WTI surges to $85.00 amid Israel-Iran tensions

WTI surges to $85.00 amid Israel-Iran tensions

Western Texas Intermediate, the US crude oil benchmark, is trading around $85.00 on Friday. The black gold gains traction on the day amid the escalating tension between Israel and Iran after a US official confirmed that Israeli missiles had hit a site in Iran.

Oil News

Dogwifhat price pumps 5% ahead of possible Coinbase effect

Dogwifhat price pumps 5% ahead of possible Coinbase effect

Dogwifhat price recorded an uptick on Thursday, going as far as to outperform its peers in the meme coins space. Second only to Bonk Inu, WIF token’s show of strength was not just influenced by Bitcoin price reclaiming above $63,000.

Read more

Forex MAJORS

Cryptocurrencies

Signatures