GBP/USD whipsaws on Monday as investor sentiment corkscrews
- GBP/USD briefly broke above 1.2700 before slumping back to opening bids.
- US data sparks rate cut hopes, then recession fears.
- Investor confidence jolted by US election risks, volatility ensues.

GBP/USD rallied briefly above the 1.2700 handle on Monday before US markets knocked back investor confidence, sparking a risk-off bid into the US Dollar and dragging Cable back down to the day’s opening bids near 1.2650.
Forex Today: All the attention shifts to Powell
US data broadly missed the mark. US ISM Manufacturing Purchasing Manager Index (PMI) figures declined in June, falling to 48.5 from 48.7 and entirely missing the forecast increase to 49.1. US ISM Manufacturing Prices Paid also declined sharply in June, falling to 52.1 from the previous 57.0, falling even further beyond the forecast decline to 55.9.
US markets were abruptly jolted into fresh risk concerns over the upcoming Presidential election slated for November. A recent public debate left the waters murky on who the clear frontrunner would be, and the US Supreme Court released a ruling on Monday stating that courts have limited capacity to levy criminal charges against sitting Presidents.
The UK has a thin economic data docket this week, though GBP traders will be keeping an eye out for Parliamentary elections on the book for Thursday. On the US side, investors will be looking ahead to Tuesday’s appearance from Federal Reserve (Fed) Chairman Jerome Powell, followed by ADP Employment Change figures on Wednesday and Friday’s latest iteration of US Nonfarm Payrolls (NFP) and Average Hourly Earnings for June.
Economic Indicator
ISM Manufacturing PMI
The Institute for Supply Management (ISM) Manufacturing Purchasing Managers Index (PMI), released on a monthly basis, is a leading indicator gauging business activity in the US manufacturing sector. The indicator is obtained from a survey of manufacturing supply executives based on information they have collected within their respective organizations. Survey responses reflect the change, if any, in the current month compared to the previous month. A reading above 50 indicates that the manufacturing economy is generally expanding, a bullish sign for the US Dollar (USD). A reading below 50 signals that factory activity is generally declining, which is seen as bearish for USD.
Read more.Last release: Mon Jul 01, 2024 14:00
Frequency: Monthly
Actual: 48.5
Consensus: 49.1
Previous: 48.7
Source: Institute for Supply Management
The Institute for Supply Management’s (ISM) Manufacturing Purchasing Managers Index (PMI) provides a reliable outlook on the state of the US manufacturing sector. A reading above 50 suggests that the business activity expanded during the survey period and vice versa. PMIs are considered to be leading indicators and could signal a shift in the economic cycle. Stronger-than-expected prints usually have a positive impact on the USD. In addition to the headline PMI, the Employment Index and the Prices Paid Index numbers are watched closely as they shine a light on the labour market and inflation.
GBP/USD technical outlook
Despite a near-term bull run to kick off the new trading week, Cable bidders were unable to keep the pressure up, and GBP/USD tumbled back below the 200-hour Exponential Moving Average (EMA) at 1.2665. Price action still favors shorts, and downside targets will be set below last week’s late low near 1.2615.
Daily candlesticks remain mired in a volatility trap between the 50-day and 200-day EMAs at 1.2668 and 1.2592, respectively. Near-term momentum still leans bearish as GBP/USD continues to drift lower after mid-June’s brief peak above 1.2850.
GBP/USD hourly chart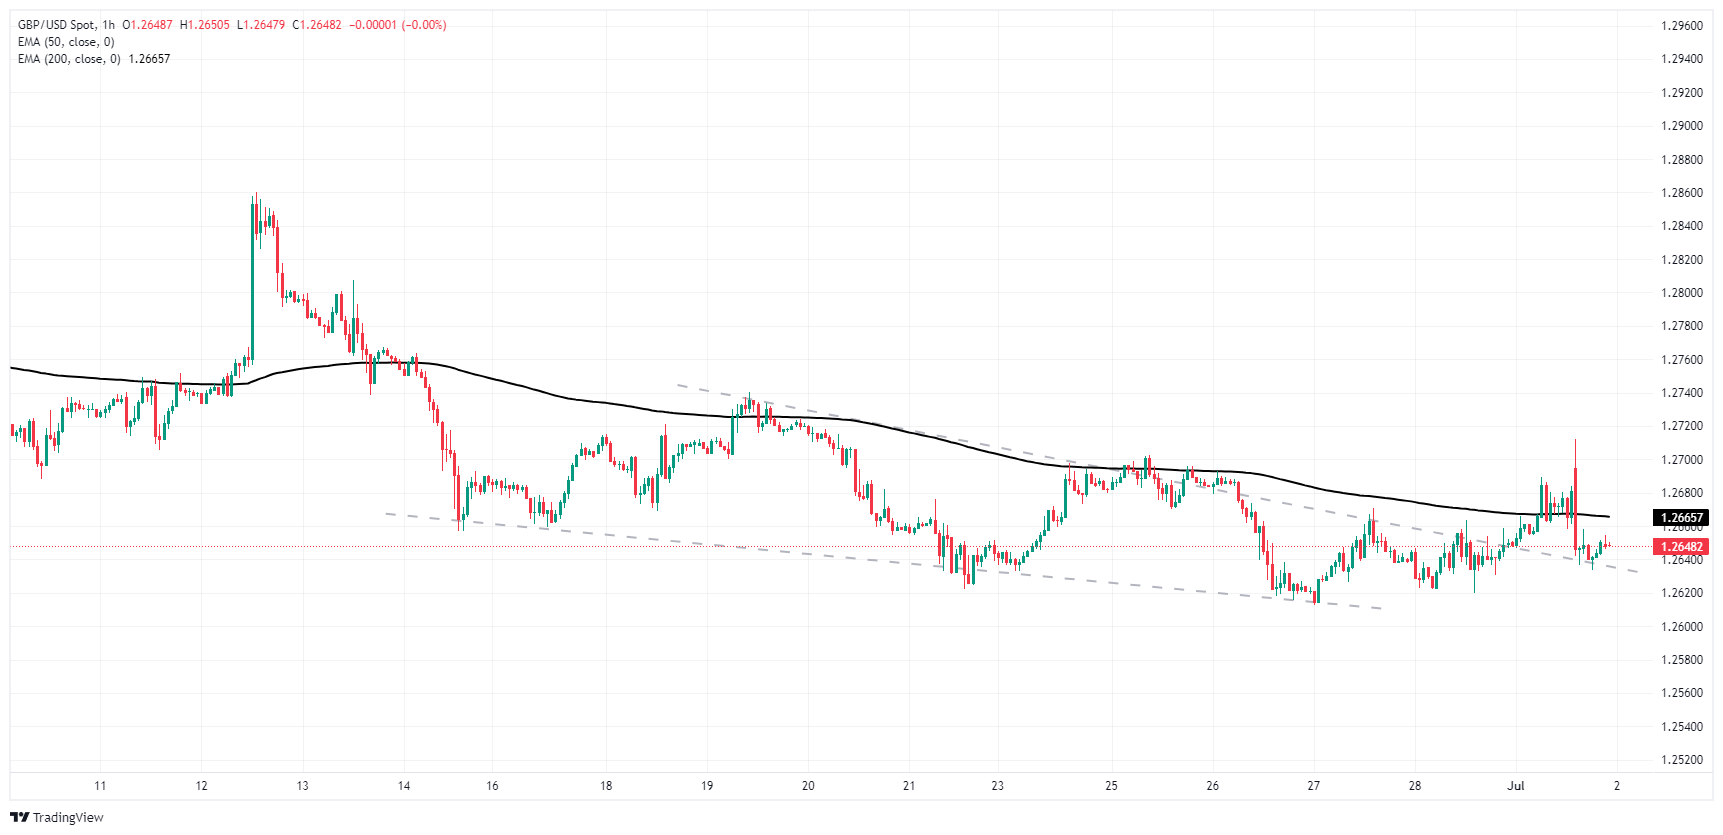
GBP/USD daily chart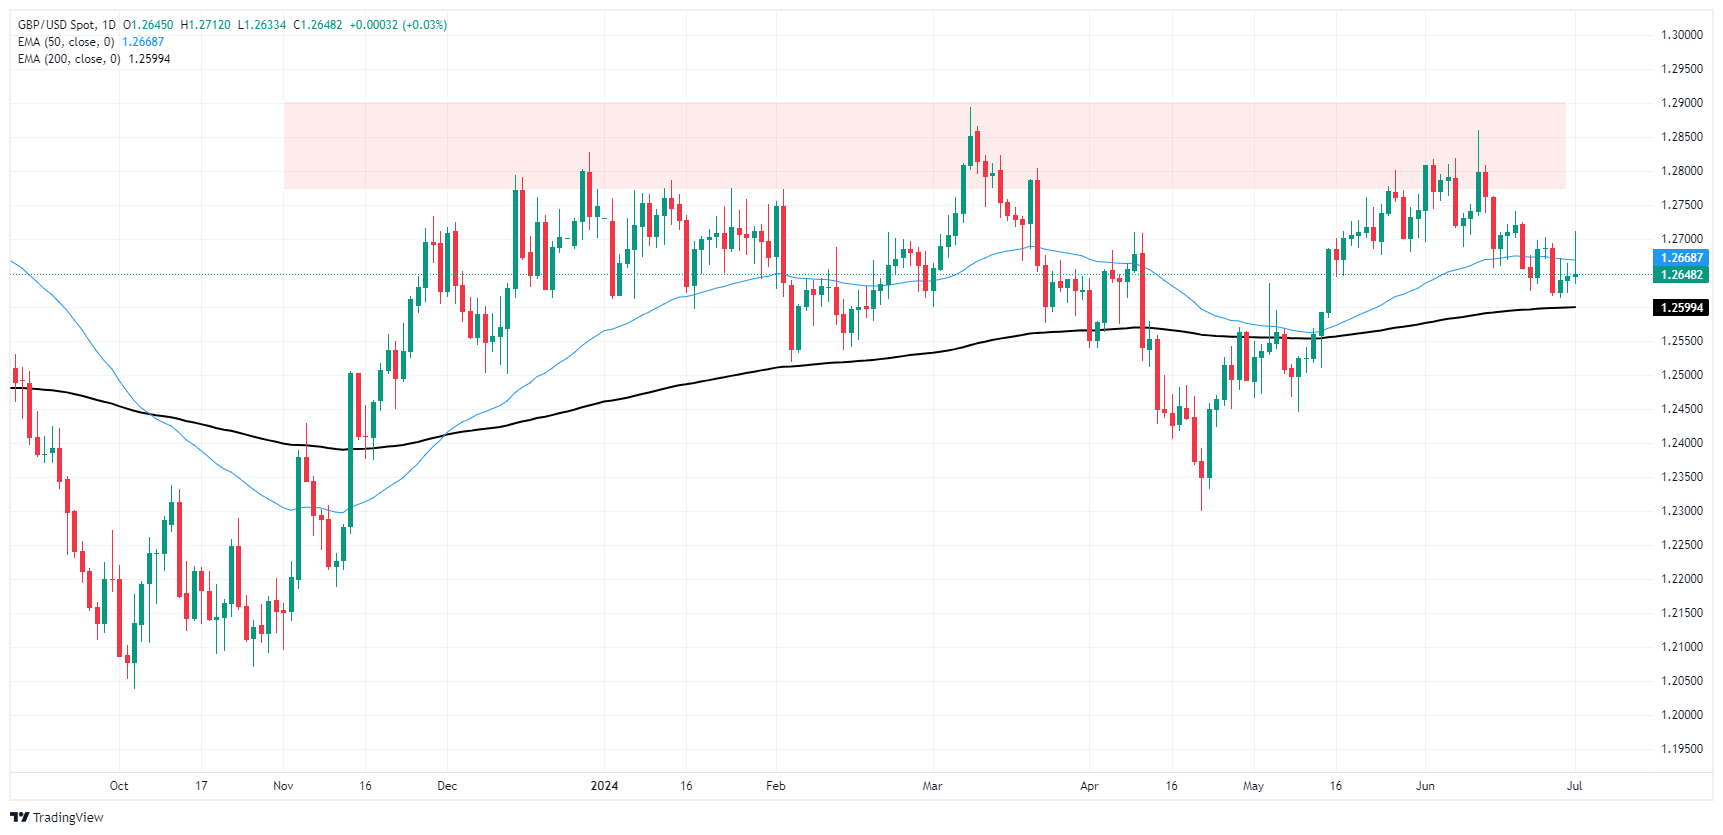
Pound Sterling FAQs
The Pound Sterling (GBP) is the oldest currency in the world (886 AD) and the official currency of the United Kingdom. It is the fourth most traded unit for foreign exchange (FX) in the world, accounting for 12% of all transactions, averaging $630 billion a day, according to 2022 data. Its key trading pairs are GBP/USD, aka ‘Cable’, which accounts for 11% of FX, GBP/JPY, or the ‘Dragon’ as it is known by traders (3%), and EUR/GBP (2%). The Pound Sterling is issued by the Bank of England (BoE).
The single most important factor influencing the value of the Pound Sterling is monetary policy decided by the Bank of England. The BoE bases its decisions on whether it has achieved its primary goal of “price stability” – a steady inflation rate of around 2%. Its primary tool for achieving this is the adjustment of interest rates. When inflation is too high, the BoE will try to rein it in by raising interest rates, making it more expensive for people and businesses to access credit. This is generally positive for GBP, as higher interest rates make the UK a more attractive place for global investors to park their money. When inflation falls too low it is a sign economic growth is slowing. In this scenario, the BoE will consider lowering interest rates to cheapen credit so businesses will borrow more to invest in growth-generating projects.
Data releases gauge the health of the economy and can impact the value of the Pound Sterling. Indicators such as GDP, Manufacturing and Services PMIs, and employment can all influence the direction of the GBP. A strong economy is good for Sterling. Not only does it attract more foreign investment but it may encourage the BoE to put up interest rates, which will directly strengthen GBP. Otherwise, if economic data is weak, the Pound Sterling is likely to fall.
Another significant data release for the Pound Sterling is the Trade Balance. This indicator measures the difference between what a country earns from its exports and what it spends on imports over a given period. If a country produces highly sought-after exports, its currency will benefit purely from the extra demand created from foreign buyers seeking to purchase these goods. Therefore, a positive net Trade Balance strengthens a currency and vice versa for a negative balance.
Author

Joshua Gibson
FXStreet
Joshua joins the FXStreet team as an Economics and Finance double major from Vancouver Island University with twelve years' experience as an independent trader focusing on technical analysis.


