GBP/USD technical analysis: 1.2880, 3-week-old falling trendline limit immediate upside
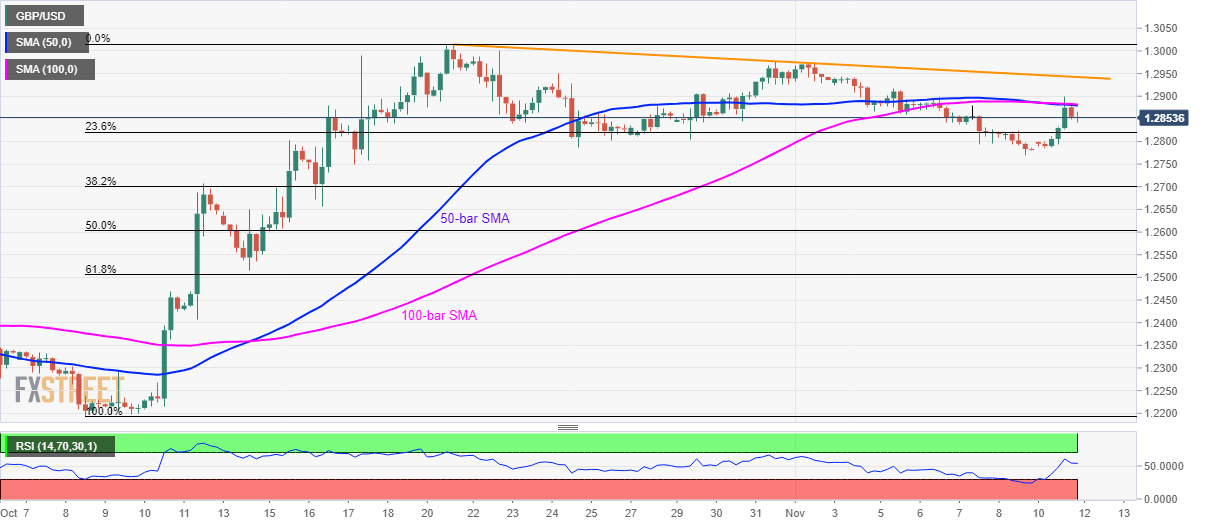
- GBP/USD trades below 50/100-bar SMA confluence.
- A descending trend-line since October 21 adds to the resistance.
- Sellers will look for entry below the recent low.

The GBP/USD pair’s recent pullback from 50/100-bar SMA confluence requires confirmation. The quote current takes the rounds to 1.2855 by the press time of early Asian session on Tuesday.
Despite pair’s U-turn from the key Simple Moving Averages (SMA), sellers await entry below the recent low near 1.2770 in order to aim for early October highs near 1.2710.
During the bear’s extended rule below 1.2710, 50% and 61.8% Fibonacci retracements of October month upside, at 1.2603 and 1.2506 respectively, will gain the market attention.
On the upside, pairs’ successful run-up beyond 1.2880 will confront the three-week-old falling resistance line, at 1.2943 now, a break of which could escalate the recovery towards 1.3000 round-figure mark.
However, bulls will wait for a sustained move beyond October high, near 1.3015/20, to aim for May month top surrounding 1.3180.
GBP/USD 4-hour chart
Trend: Pullback expected
Author

Anil Panchal
FXStreet
Anil Panchal has nearly 15 years of experience in tracking financial markets. With a keen interest in macroeconomics, Anil aptly tracks global news/updates and stays well-informed about the global financial moves and their implications.


