GBP/USD slumps to familiar lows in midweek action as Greenback bids reignite
- Rate cut hopes slowly bleed confidence on data-thin Wednesday.
- Risk-off market flows take a step higher, but remain subdued amid low-tier data.
- The latter half of the trading week kicks off a flurry of top-tier data releases.

GBP/USD backslid into familiar near-term lows on Wednesday as tepid market flows bolstered the US Dollar. The Pound Sterling remained pinned on the low side as the pair struggled to stay above 1.2600.
Wednesday brought little of note in scheduled releases, with the UK absent from the economic calendar and US New Home Sales Change in May clocking in a -11.3% decline MoM compared to the previous month’s 2.0%, revised sharply from the initial print of -4.7%.
Forex Today: Investors look at US PCE
Thursday kicks off a flurry of meaningful data after spending most of the early week in the doldrums. The Bank of England’s (BoE) latest Financial Stability Report will be published early during the London market session, followed by US Durable Goods Orders, revisions to first-quarter Gross Domestic Product (GDP), and weekly Initial Jobless Claims.
US QoQ is expected to tick upward slightly to 1.4% from the initial print of 1.3%, while May’s US Durable Goods Orders are expected to print a -0.1% contraction compared to the previous month’s revised 0.6%. US Initial Jobless Claims for the week ended June 21 are expected to tick slightly lower to 236K from the previous 238K, but the figure is expected to come in above the four-week average of 232.75K.
Friday will round out the trading week with the UK’s own quarterly GDP revisions, expected to hold steady at 0.6% QoQ, with May’s US Personal Consumption Expenditure Price Index (PCE) inflation to follow later in the day. Core PCE Price Index inflation is expected to tick down YoY to 2.6% from the previous 2.8% as market participants hope for further signs of easing inflation to help push the Federal Reserve (Fed) towards rate cuts sooner rather than later.
According to the CME’s FedWatch Tool, rate market bets of a September 18 rate trim from the Federal Open Market Committee (FOMC) have slowly bled out confidence. They are approaching 60% odds of at least a quarter-point rate cut on September 18 after peaking just above 70% last week.
British Pound PRICE This week
The table below shows the percentage change of British Pound (GBP) against listed major currencies this week. British Pound was the strongest against the New Zealand Dollar.
| USD | EUR | GBP | JPY | CAD | AUD | NZD | CHF | |
|---|---|---|---|---|---|---|---|---|
| USD | 0.12% | 0.17% | 0.58% | 0.08% | -0.11% | 0.57% | 0.36% | |
| EUR | -0.12% | 0.07% | 0.53% | 0.01% | -0.20% | 0.50% | 0.32% | |
| GBP | -0.17% | -0.07% | 0.39% | -0.06% | -0.28% | 0.42% | 0.24% | |
| JPY | -0.58% | -0.53% | -0.39% | -0.49% | -0.66% | 0.04% | -0.22% | |
| CAD | -0.08% | -0.01% | 0.06% | 0.49% | -0.18% | 0.48% | 0.30% | |
| AUD | 0.11% | 0.20% | 0.28% | 0.66% | 0.18% | 0.70% | 0.52% | |
| NZD | -0.57% | -0.50% | -0.42% | -0.04% | -0.48% | -0.70% | -0.19% | |
| CHF | -0.36% | -0.32% | -0.24% | 0.22% | -0.30% | -0.52% | 0.19% |
The heat map shows percentage changes of major currencies against each other. The base currency is picked from the left column, while the quote currency is picked from the top row. For example, if you pick the British Pound from the left column and move along the horizontal line to the US Dollar, the percentage change displayed in the box will represent GBP (base)/USD (quote).
GBP/USD technical outlook
The Cable has extended a two-week backslide as the pair tumbles from the last swing high to 1.2860, shedding the 50-day Exponential Moving Average (EMA) at 1.2671 and is now within touch range of major technical support from the 200-day EMA at 1.2600.
A supply zone priced in above 1.2800 is firmly crimping bullish momentum, and an extended bearish decline will push the GBP/USD down to April’s swing low into 1.2300.
GBP/USD daily chart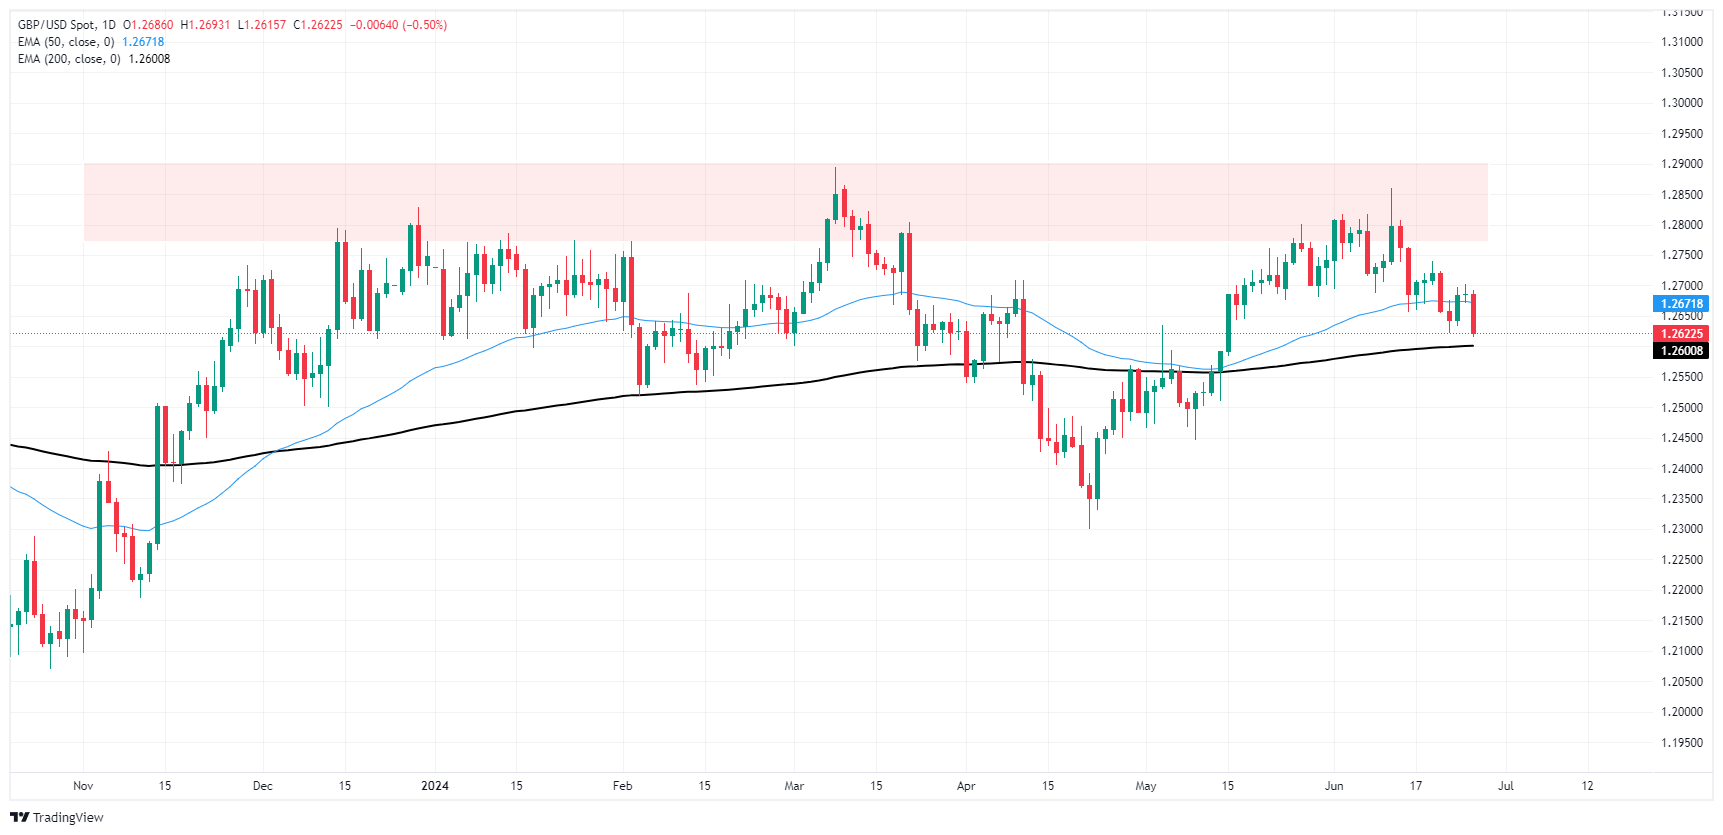
Pound Sterling FAQs
The Pound Sterling (GBP) is the oldest currency in the world (886 AD) and the official currency of the United Kingdom. It is the fourth most traded unit for foreign exchange (FX) in the world, accounting for 12% of all transactions, averaging $630 billion a day, according to 2022 data. Its key trading pairs are GBP/USD, aka ‘Cable’, which accounts for 11% of FX, GBP/JPY, or the ‘Dragon’ as it is known by traders (3%), and EUR/GBP (2%). The Pound Sterling is issued by the Bank of England (BoE).
The single most important factor influencing the value of the Pound Sterling is monetary policy decided by the Bank of England. The BoE bases its decisions on whether it has achieved its primary goal of “price stability” – a steady inflation rate of around 2%. Its primary tool for achieving this is the adjustment of interest rates. When inflation is too high, the BoE will try to rein it in by raising interest rates, making it more expensive for people and businesses to access credit. This is generally positive for GBP, as higher interest rates make the UK a more attractive place for global investors to park their money. When inflation falls too low it is a sign economic growth is slowing. In this scenario, the BoE will consider lowering interest rates to cheapen credit so businesses will borrow more to invest in growth-generating projects.
Data releases gauge the health of the economy and can impact the value of the Pound Sterling. Indicators such as GDP, Manufacturing and Services PMIs, and employment can all influence the direction of the GBP. A strong economy is good for Sterling. Not only does it attract more foreign investment but it may encourage the BoE to put up interest rates, which will directly strengthen GBP. Otherwise, if economic data is weak, the Pound Sterling is likely to fall.
Another significant data release for the Pound Sterling is the Trade Balance. This indicator measures the difference between what a country earns from its exports and what it spends on imports over a given period. If a country produces highly sought-after exports, its currency will benefit purely from the extra demand created from foreign buyers seeking to purchase these goods. Therefore, a positive net Trade Balance strengthens a currency and vice versa for a negative balance.
Author

Joshua Gibson
FXStreet
Joshua joins the FXStreet team as an Economics and Finance double major from Vancouver Island University with twelve years' experience as an independent trader focusing on technical analysis.


