GBP/USD Price Forecast: Struggles at 1.3000, yet remains flat
- GBP/USD slips below the 50-DMA, signaling a bearish shift despite its recent recovery towards 1.3000.
- Bearish momentum in the RSI hints at a deeper correction if the pair closes below 1.3000 consecutively.
- Key support levels include the 100-DMA at 1.2954 and the bottom of the ascending channel around 1.2890/1.2910.

The Pound Sterling recovered some ground yet cannot hold firm above the 1.3000 figure against the Greenback. Absent data releases in the UK kept traders adrift to a goodish US Retail Sales report, along with a dip in unemployment claims. At the time of writing, the GBP/USD trades at 1.2991, virtually unchanged.
GBP/USD Price Forecast: Technical outlook
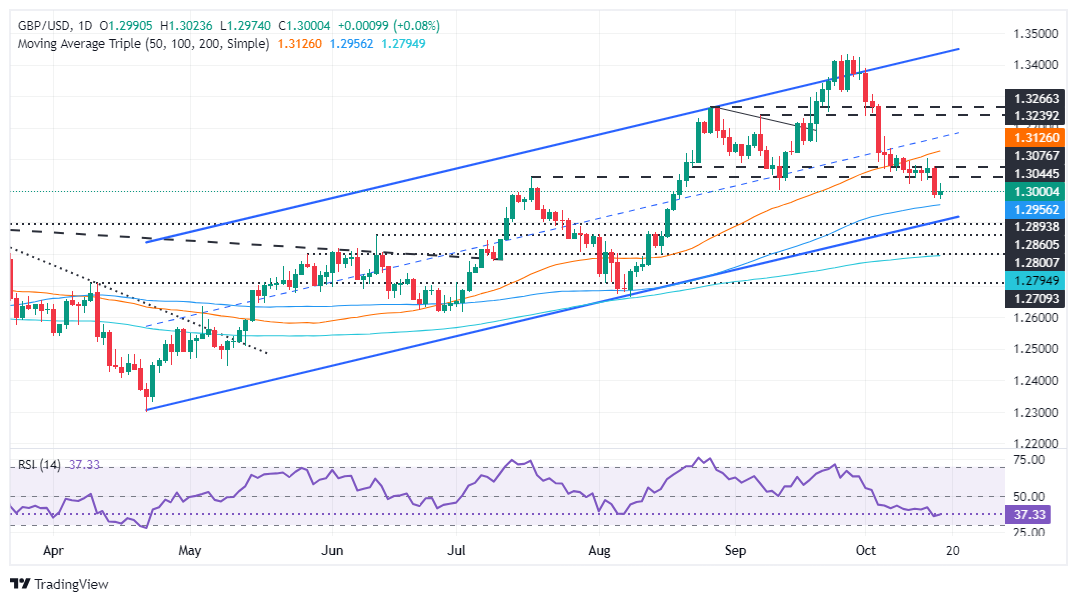
Price action suggests the GBP/USD is still upwardly biased, but since it has fallen below the 50-day moving average, it has opened the door for lower prices.
From a momentum standpoint, the Relative Strength Index (RSI) is bearish. Hence, if the GBP/USD achieves back-to-back daily closes below 1.3000, it could be headed for a deeper pullback.
Given the backdrop, the first support for GBP/USD would be the 100-DMA at 1.2954. Once cleared, the next support would be the bottom trendline of an ascending channel at around 1.2890/1.2910, followed by the June 12 peak turned support at 1.2861. The next support would be the 200-DMA at 1.2794.
Conversely, if GBP/USD holds firm above 1.3000, buyers can drive the exchange rate towards the weekly high of 1.3102 before testing the 50-DMA at 1.3122.
GBP/USD Price Action – Daily Chart
British Pound PRICE Today
The table below shows the percentage change of British Pound (GBP) against listed major currencies today. British Pound was the strongest against the Euro.
| USD | EUR | GBP | JPY | CAD | AUD | NZD | CHF | |
|---|---|---|---|---|---|---|---|---|
| USD | 0.35% | -0.07% | 0.24% | 0.25% | -0.52% | -0.11% | -0.09% | |
| EUR | -0.35% | -0.43% | -0.10% | -0.10% | -0.86% | -0.43% | -0.43% | |
| GBP | 0.07% | 0.43% | 0.33% | 0.33% | -0.44% | -0.02% | 0.01% | |
| JPY | -0.24% | 0.10% | -0.33% | 0.02% | -0.76% | -0.37% | -0.30% | |
| CAD | -0.25% | 0.10% | -0.33% | -0.02% | -0.77% | -0.34% | -0.31% | |
| AUD | 0.52% | 0.86% | 0.44% | 0.76% | 0.77% | 0.42% | 0.46% | |
| NZD | 0.11% | 0.43% | 0.02% | 0.37% | 0.34% | -0.42% | 0.03% | |
| CHF | 0.09% | 0.43% | -0.01% | 0.30% | 0.31% | -0.46% | -0.03% |
The heat map shows percentage changes of major currencies against each other. The base currency is picked from the left column, while the quote currency is picked from the top row. For example, if you pick the British Pound from the left column and move along the horizontal line to the US Dollar, the percentage change displayed in the box will represent GBP (base)/USD (quote).
Author

Christian Borjon Valencia
FXStreet
Markets analyst, news editor, and trading instructor with over 14 years of experience across FX, commodities, US equity indices, and global macro markets.


