GBP/USD Price Forecast: Inches higher, yet struggles at 1.2785
- GBP/USD trades at 1.2760, up 0.11%, as it nears key resistance at 1.2785.
- Range-bound movement persists between 1.2680 and 1.2785, with mixed momentum signals.
- A break above 1.2785 targets 1.2800 and 1.2888, while a drop below 1.2657 could see a test of 1.2600 and 1.2445.

The Pound Sterling continued to register gains on Friday yet found some resistance at 1.2773, shy of hitting the 50-day moving average (DMA) at 1.2785, which, if cleared, could pave the way for further upside. However, the GBP/USD retreats somewhat and registers modest gains of 0.11%, trading at 1.2760.
GBP/USD Price Forecast: Technical outlook
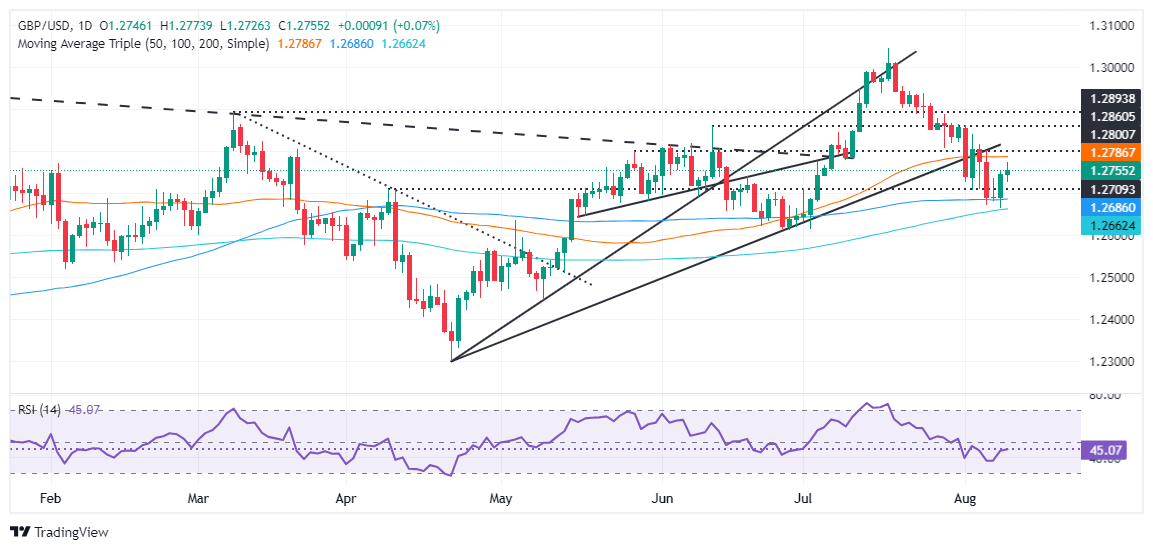
After seesawing through most of the week, the GBP/USD pair has been range-bound, capped within the 1.2680-1.2785 range for the last four days, with key daily moving averages (DMAs) acting as support/resistance.
Momentum is also mixed, with the Relative Strength Index (RSI) standing bearish yet aiming slightly up.
Hence if GBP/USD clears the top of the range, that could pave the way for higher prices. The first resistance would be the 1.2800 figure. Despite that, buyers need to reclaim the July 29 peak at 1.2888, before challenging the 1.2900 figure.
Conversely, if sellers stepped in, they would test the 200-DMA at 1.2657. Once cleared, the pair would shift bearish, and it can challenge the 1.2600 mark. Underneath this level, bears could drag the spot price to test the latest cycle low of 1.2445, the May 9 low.
GBP/USD Price Action – Daily Chart
British Pound PRICE Today
The table below shows the percentage change of British Pound (GBP) against listed major currencies today. British Pound was the strongest against the Australian Dollar.
| USD | EUR | GBP | JPY | CAD | AUD | NZD | CHF | |
|---|---|---|---|---|---|---|---|---|
| USD | -0.01% | -0.07% | -0.47% | -0.04% | 0.32% | 0.13% | -0.30% | |
| EUR | 0.00% | -0.04% | -0.40% | -0.03% | 0.33% | 0.14% | -0.29% | |
| GBP | 0.07% | 0.04% | -0.37% | -0.01% | 0.37% | 0.17% | -0.22% | |
| JPY | 0.47% | 0.40% | 0.37% | 0.37% | 0.76% | 0.55% | 0.16% | |
| CAD | 0.04% | 0.03% | 0.00% | -0.37% | 0.35% | 0.17% | -0.23% | |
| AUD | -0.32% | -0.33% | -0.37% | -0.76% | -0.35% | -0.19% | -0.59% | |
| NZD | -0.13% | -0.14% | -0.17% | -0.55% | -0.17% | 0.19% | -0.40% | |
| CHF | 0.30% | 0.29% | 0.22% | -0.16% | 0.23% | 0.59% | 0.40% |
The heat map shows percentage changes of major currencies against each other. The base currency is picked from the left column, while the quote currency is picked from the top row. For example, if you pick the British Pound from the left column and move along the horizontal line to the US Dollar, the percentage change displayed in the box will represent GBP (base)/USD (quote).
Author

Christian Borjon Valencia
FXStreet
Markets analyst, news editor, and trading instructor with over 14 years of experience across FX, commodities, US equity indices, and global macro markets.


