GBP/USD Price Forecast: Faces rejection near 100-day SMA, holds above mid-1.2900s
- GBP/USD edges lower on Friday amid the emergence of some USD dip-buying.
- The BoE’s hawkish tilt could underpin the GBP and limit losses for the major.
- The technical setup favors bears and supports prospects for a further downfall.

The GBP/USD pair struggles to build on the previous day's positive move and faces rejection near the 100-day Simple Moving Average (SMA) during the Asian session on Friday. Spot prices currently trade around the 1.2965-1.2960 region, down 0.15% for the day amid a modest US Dollar (USD) uptick, though the downside seems limited on the back of the Bank of England's (BoE) hawkish stance.
In fact, the BoE warned that the expansive Autumn Budget introduced by Chancellor Rachel Reeves is expected to fuel inflation, suggesting that it adopt a cautious stance toward rate cuts in 2025. In contrast, the Federal Reserve (Fed) Chair Jerome Powell failed to offer any cues that the central bank was likely to pause rate cuts in the near term. This leads to a further decline in the US Treasury bond yields and might hold back the USD bulls from placing aggressive bets, which, in turn, should offer support to the GBP/USD pair.
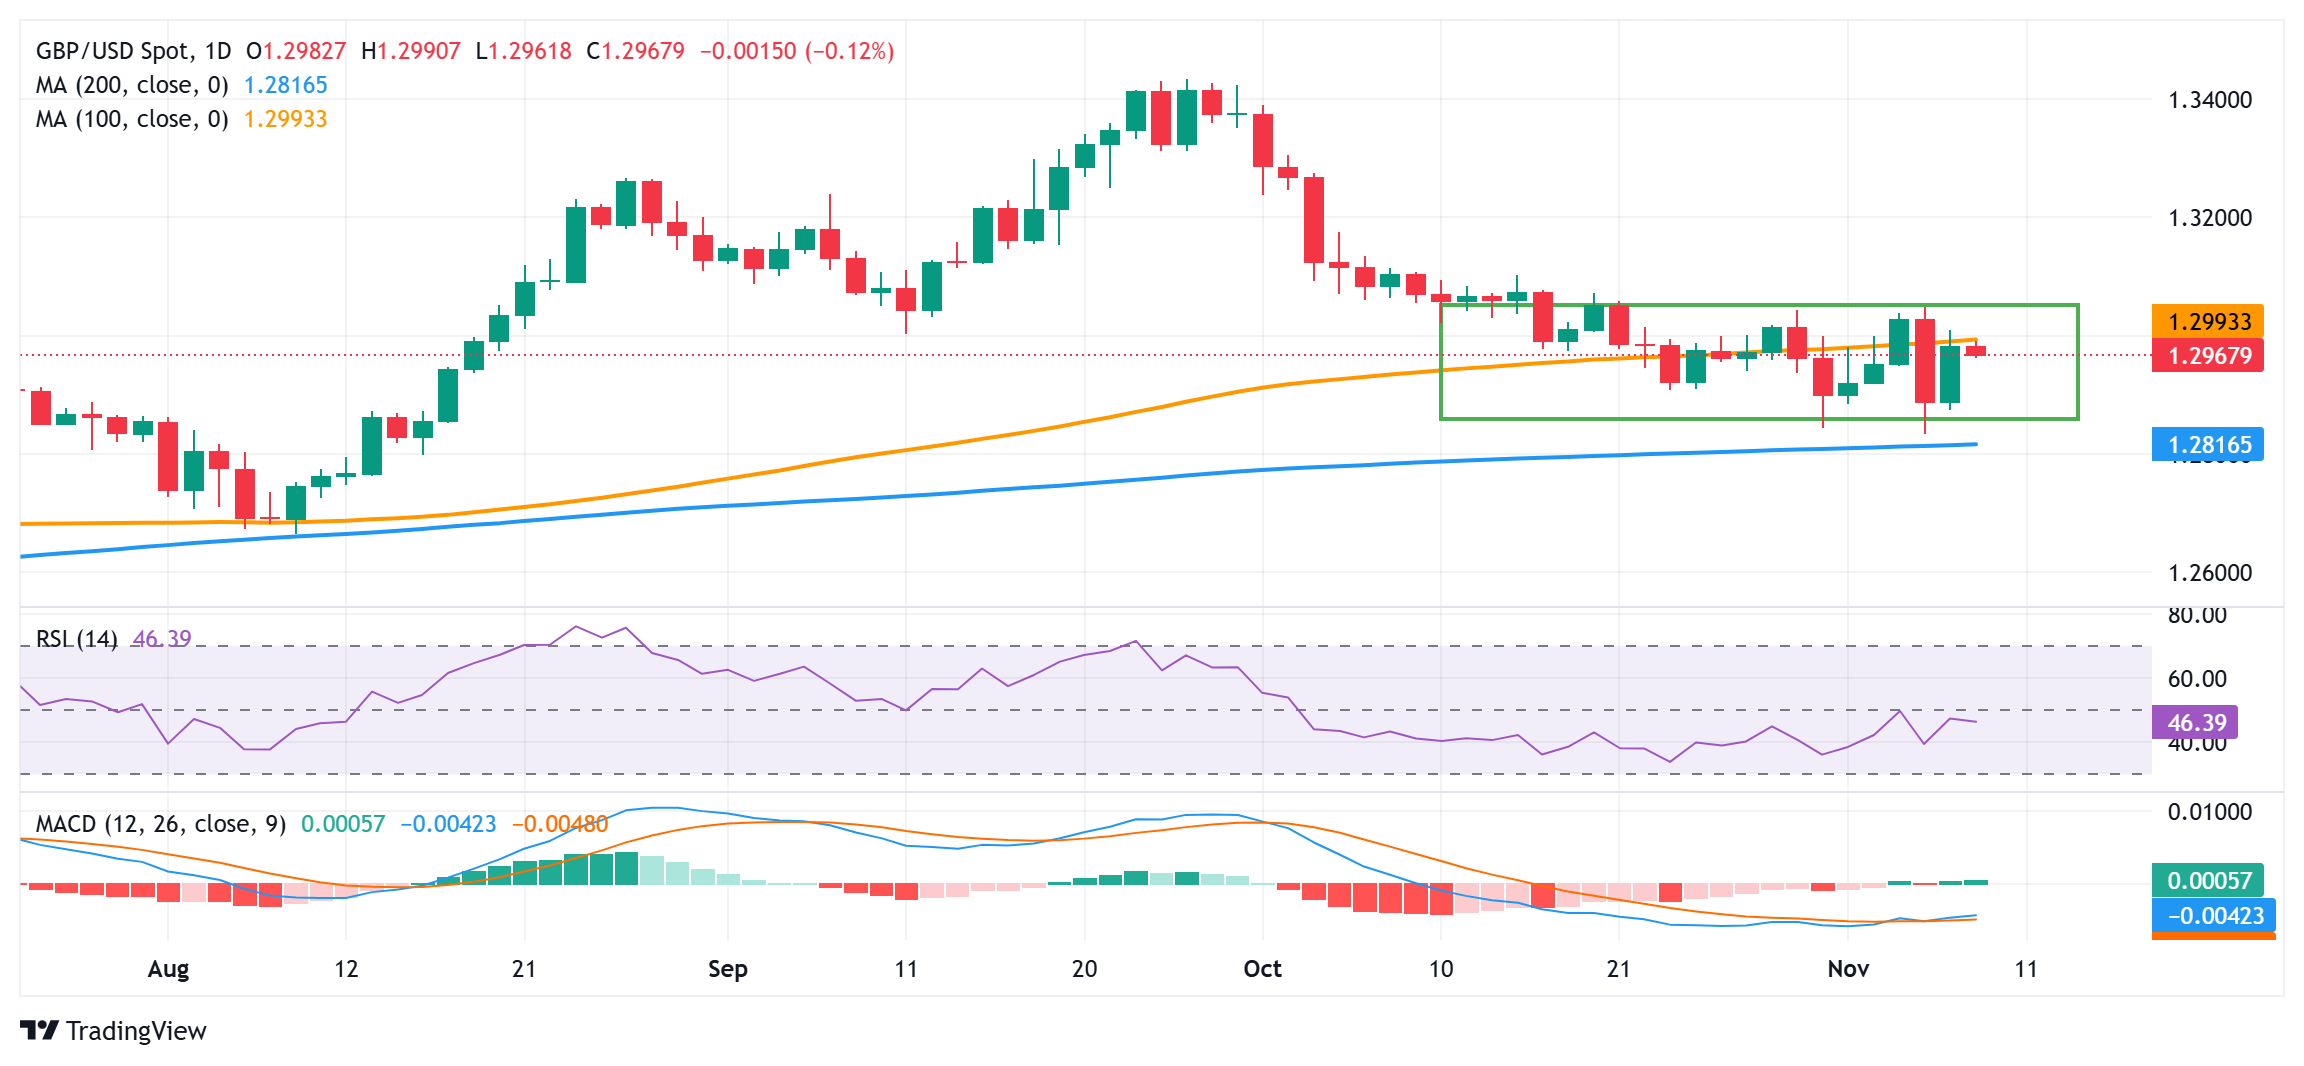
From a technical perspective, the range-bound price action witnessed over the past three weeks or so could be categorized as a bearish consolidation phase against the backdrop of the recent pullback from the highest level since February 2022. Moreover, failure to build on this week's recovery from a nearly three-month low, around the 1.2835 region, suggests that the path of least resistance for the GBP/USD pair is to the downside. The outlook is reinforced by the fact that oscillators on the daily chart are holding in negative territory.
That said, it will still be prudent to wait for a sustained break and acceptance below the 1.2900 mark before positioning for a fallback towards the 200-day SMA, currently pegged near the 1.2815 region. This is followed by the 1.2800 round figure, which if broken should pave the way for a further near-term depreciating move and drag the GBP/USD pair to the 1.2765 intermediate support en route to the 1.2700 mark. The downward trajectory could extend further towards the August monthly swing low, around the 1.2665 area.
On the flip side, bulls need to wait for a move beyond the 100-day SMA and the 1.3000 psychological mark before positioning for any meaningful appreciating move. The GBP/USD pair might then climb to the 1.3070 supply zone and then aim to reclaim the 1.3100 mark. Some follow-through buying will suggest that a one-month-old corrective decline has run its course and shift the near-term bias back in favor of bullish traders.
GBP/USD daily chart
US Dollar PRICE Today
The table below shows the percentage change of US Dollar (USD) against listed major currencies today. US Dollar was the strongest against the Australian Dollar.
| USD | EUR | GBP | JPY | CAD | AUD | NZD | CHF | |
|---|---|---|---|---|---|---|---|---|
| USD | 0.18% | 0.12% | -0.17% | 0.14% | 0.38% | 0.31% | 0.12% | |
| EUR | -0.18% | -0.07% | -0.31% | -0.04% | 0.20% | 0.13% | -0.06% | |
| GBP | -0.12% | 0.07% | -0.26% | 0.02% | 0.27% | 0.19% | 0.00% | |
| JPY | 0.17% | 0.31% | 0.26% | 0.30% | 0.54% | 0.47% | 0.28% | |
| CAD | -0.14% | 0.04% | -0.02% | -0.30% | 0.24% | 0.18% | -0.02% | |
| AUD | -0.38% | -0.20% | -0.27% | -0.54% | -0.24% | -0.07% | -0.26% | |
| NZD | -0.31% | -0.13% | -0.19% | -0.47% | -0.18% | 0.07% | -0.20% | |
| CHF | -0.12% | 0.06% | 0.00% | -0.28% | 0.02% | 0.26% | 0.20% |
The heat map shows percentage changes of major currencies against each other. The base currency is picked from the left column, while the quote currency is picked from the top row. For example, if you pick the US Dollar from the left column and move along the horizontal line to the Japanese Yen, the percentage change displayed in the box will represent USD (base)/JPY (quote).
Author

Haresh Menghani
FXStreet
Haresh Menghani is a detail-oriented professional with 10+ years of extensive experience in analysing the global financial markets.


