- GBP/USD looks for a firm direction near one-week low.
- A downside break of 200-day EMA, RSI conditions keep the sellers hopeful.
- A confluence of 100-day EMA and 61.8% Fibonacci retracement question the bears.
- UK’s April month Industrial Production, GDP decorate the economic calendar.
Having slipped to the lowest since June 04, GBP/USD seesaws around 1.2580 during Friday’s Asian session. The Cable bears seem to catch a breather after the previous day’s heavy fall ahead of the key US data.
Read: UK GDP Preview: A 20% plunge could serve as a third blow to sterling, three scenarios
However, the pair’s sustained trading below 200-day EMA, as well as an absence of oversold RSI, directs the sellers towards a confluence of 100-day EMA and 61.8% Fibonacci retracement of March month’s fall.
Should the GBP/USD prices remain weak below 1.2520/15 support, an ascending trend line from March 20, around 1.2375, will be the key to watch.
On the upside, the pair’s breakout of 200-day EMA, at 1.2615 now, could attempt another rise to aim for 1.2800 and then to the monthly high near 1.2813. In doing so, February month low near 1.2725 might offer an intermediate halt during the run-up.
GBP/USD daily chart
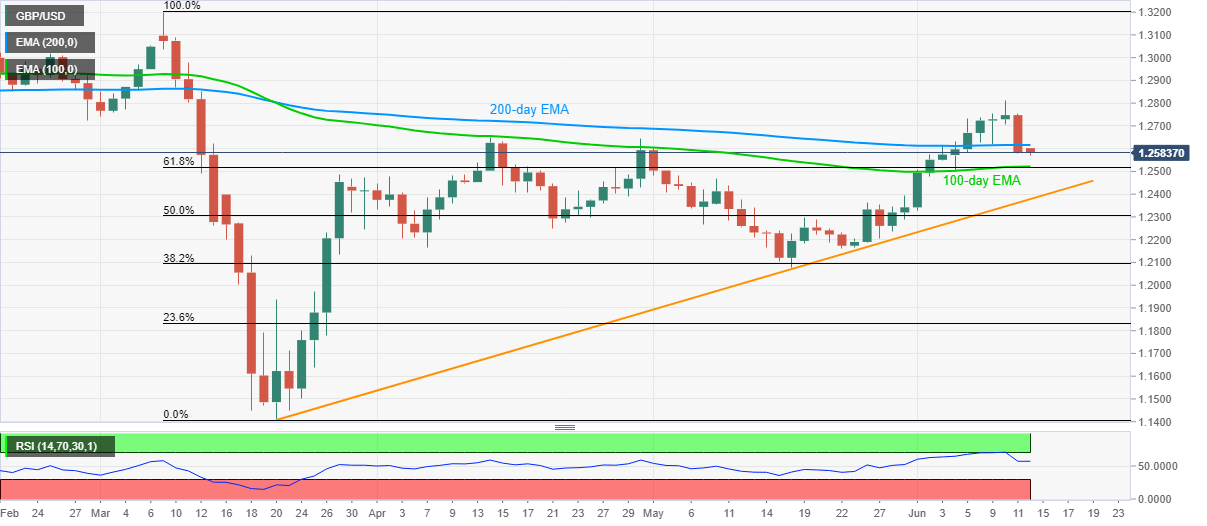
Trend: Further weakness expected
Information on these pages contains forward-looking statements that involve risks and uncertainties. Markets and instruments profiled on this page are for informational purposes only and should not in any way come across as a recommendation to buy or sell in these assets. You should do your own thorough research before making any investment decisions. FXStreet does not in any way guarantee that this information is free from mistakes, errors, or material misstatements. It also does not guarantee that this information is of a timely nature. Investing in Open Markets involves a great deal of risk, including the loss of all or a portion of your investment, as well as emotional distress. All risks, losses and costs associated with investing, including total loss of principal, are your responsibility. The views and opinions expressed in this article are those of the authors and do not necessarily reflect the official policy or position of FXStreet nor its advertisers. The author will not be held responsible for information that is found at the end of links posted on this page.
If not otherwise explicitly mentioned in the body of the article, at the time of writing, the author has no position in any stock mentioned in this article and no business relationship with any company mentioned. The author has not received compensation for writing this article, other than from FXStreet.
FXStreet and the author do not provide personalized recommendations. The author makes no representations as to the accuracy, completeness, or suitability of this information. FXStreet and the author will not be liable for any errors, omissions or any losses, injuries or damages arising from this information and its display or use. Errors and omissions excepted.
The author and FXStreet are not registered investment advisors and nothing in this article is intended to be investment advice.
Recommended content
Editors’ Picks
EUR/USD drops to near 1.0850, further support at nine-day EMA

EUR/USD continues to lose ground, trading around 1.0860 during the Asian hours on Friday. From a technical perspective on a daily chart analysis indicates a sideways trend for the pair as it continues to lie within the symmetrical triangle.
GBP/USD posts modest gains above 1.2650, focus on the Fedspeak

The GBP/USD pair posts modest gains near 1.2670 during the Asian session on Friday. Meanwhile, the USD Index recovers some lost ground after retracing to multi-week lows near 104.00 in the previous session.
Gold price loses momentum, with Fed speakers in focus

Gold price trades with a bearish bias on Friday after retreating from the nearly $2,400 barrier. The bullish move of precious metals in the previous sessions was bolstered by the softer-than-expected US inflation data in April, which triggered hope for rate cuts from the US Federal Reserve.
LINK price jumps 10% as Chainlink races toward tokenization of funds

Chainlink price has remained range-bound for a while, stuck between the $16.00 roadblock to the upside and $13.08 to the downside. However, in light of recent revelations, the token may have further upside potential.
Fed speak tempers rate cut expectations
The biggest takeaway into Friday is the latest round of Fed speak. These Fed officials reiterated their stance rates should be kept restrictive for a longer period of time until there is more clear evidence inflation is heading back towards the 2% target.