|

GBP/USD Price Analysis: Sell-off cutting into Day-3 longs, 1.2050 eyed for days ahead

  • GBP/USD has sold off from a 50% mean reversion of the prior bearish daily impulse. 
  • We are seeing the following through with 1.20 eyed but the price is meeting some support at this juncture.
  • This opens the risk of a correction before the next move to the downside.

GBP/USD rallied in a parabolic fashion on Thursday on the third day of demand for the British Pound. The pair travelled from a low of 1.2056 to a high of 1.2194 before reversing back to test the midpoint of the 1.21 area and recently reaching a sell-off low of 1.2130. 

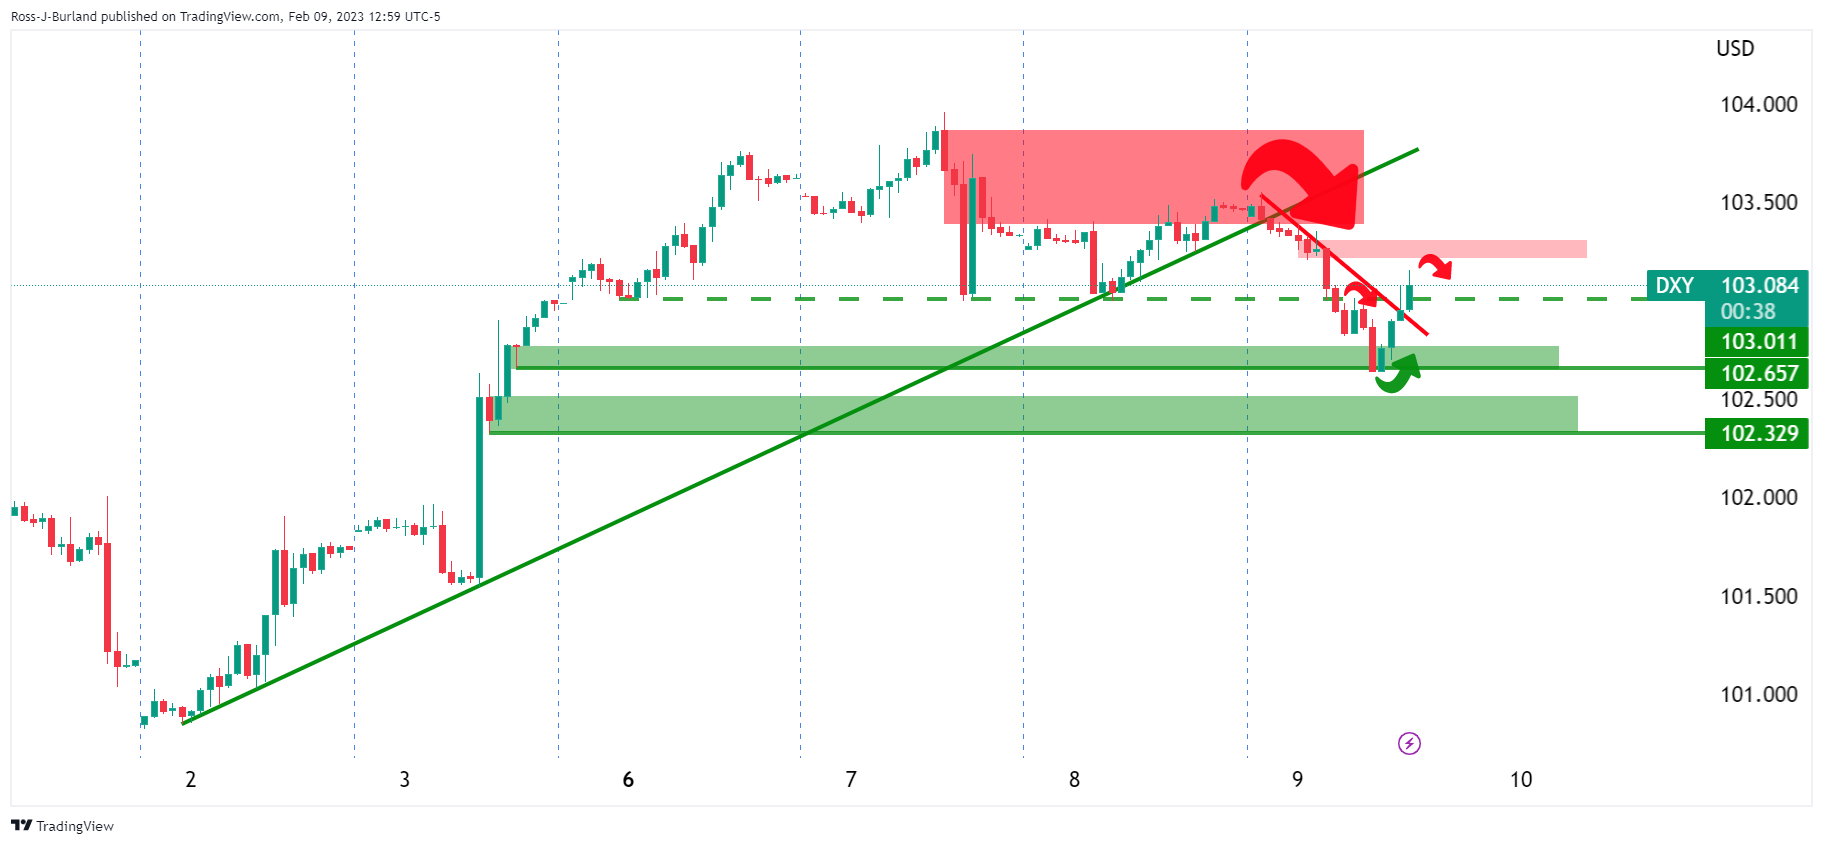
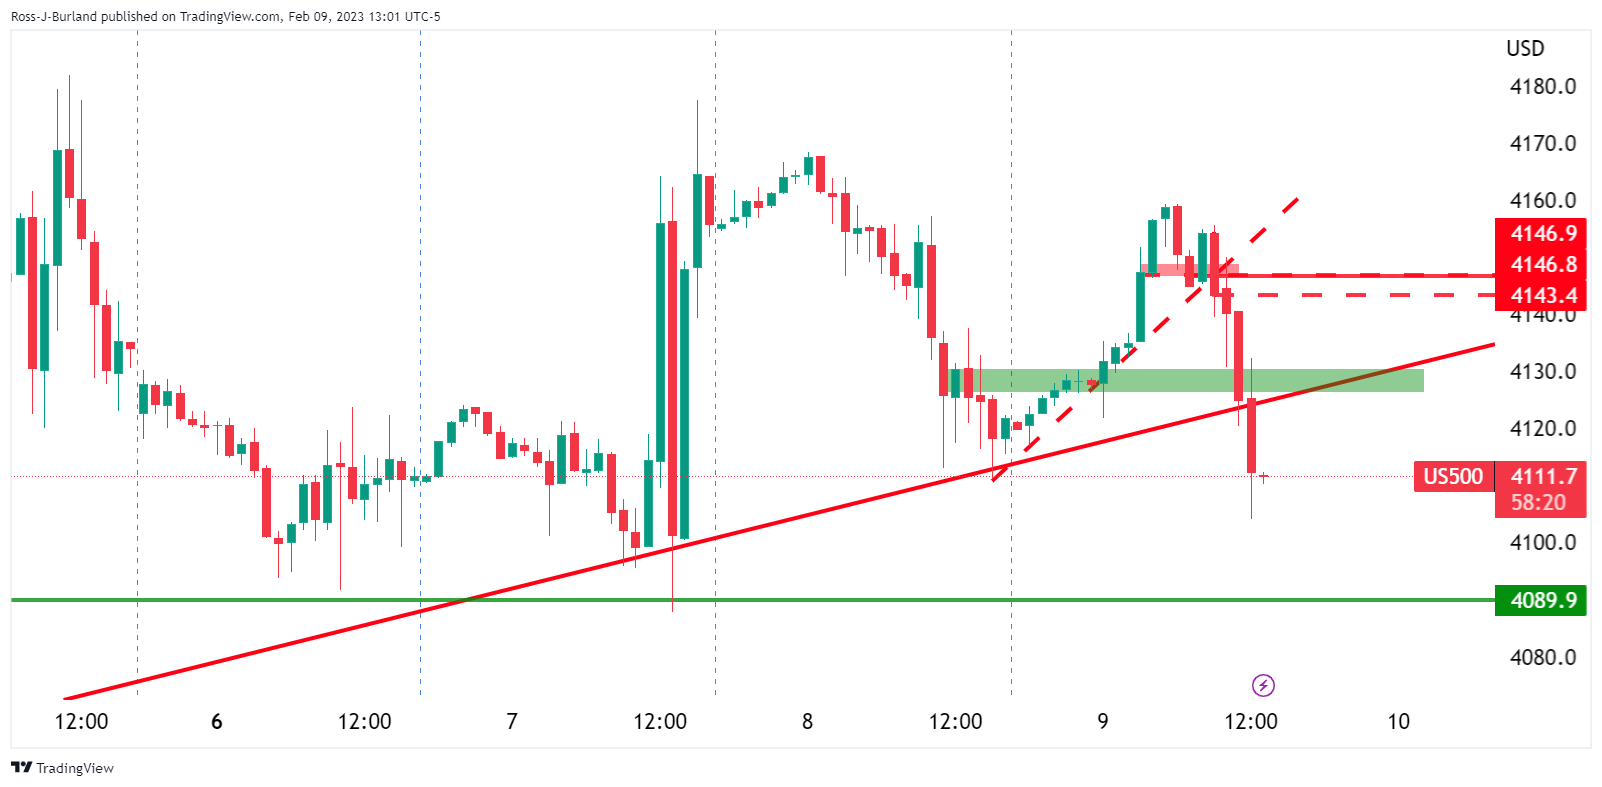
The US Dollar broke structure on the downside in the late London session and extended the move into the New York open only to reverse. Risk-off kicked in and sent the US bourses packing and cable off a cliff as the following illustrates:

DXY H1 chart

US500 H1 chart

GBP/USD technical analysis

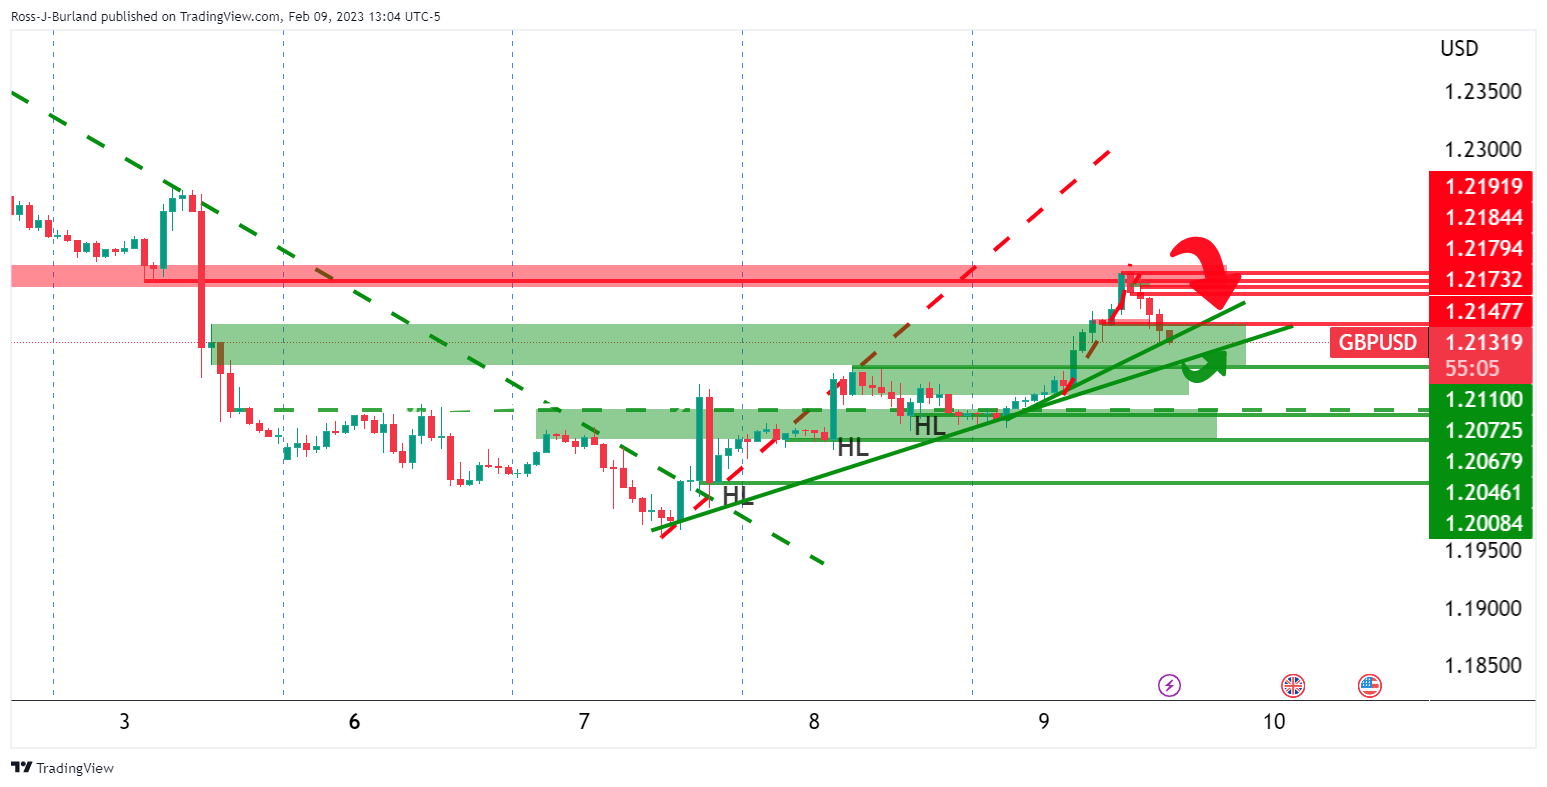
GBP/USD has dropped into the parabolic rally and the length that had been building up into a climax. We had three levels of rise since the day opened in Asia in a massive pump-up that has concluded in a dump in the New York session. this coincided with the cash opening hour on Wall Street, 1730 GMT and at the London fix of 1600 GMT.

We are seeing the followthrough with 1.20 eyed but the price is meeting some support at this juncture:

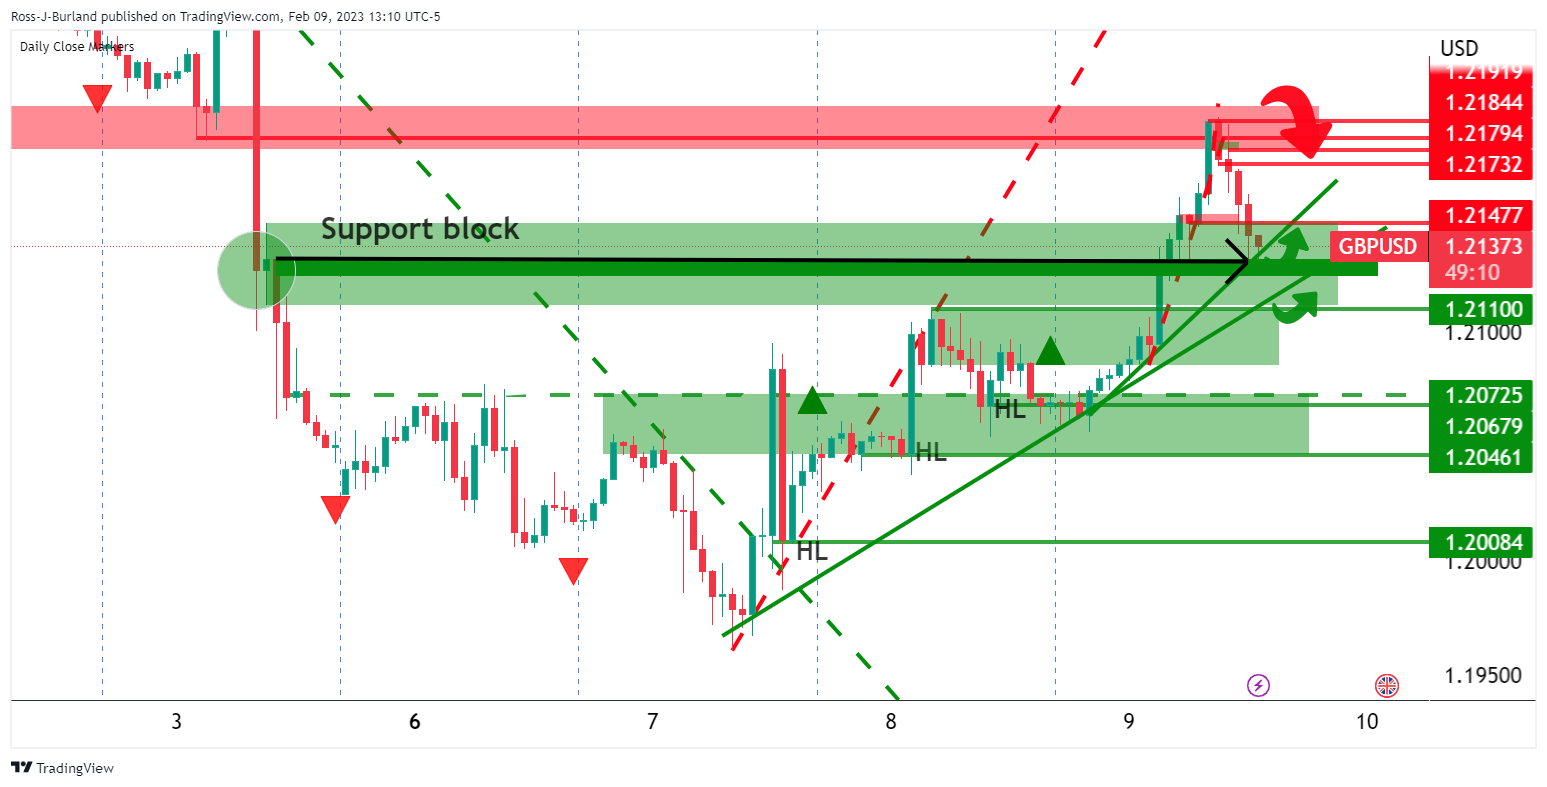
This opens the risk of a correction before the next move to the downside with the ATR of 117 pips for the day already done within the 137 pip range so far:

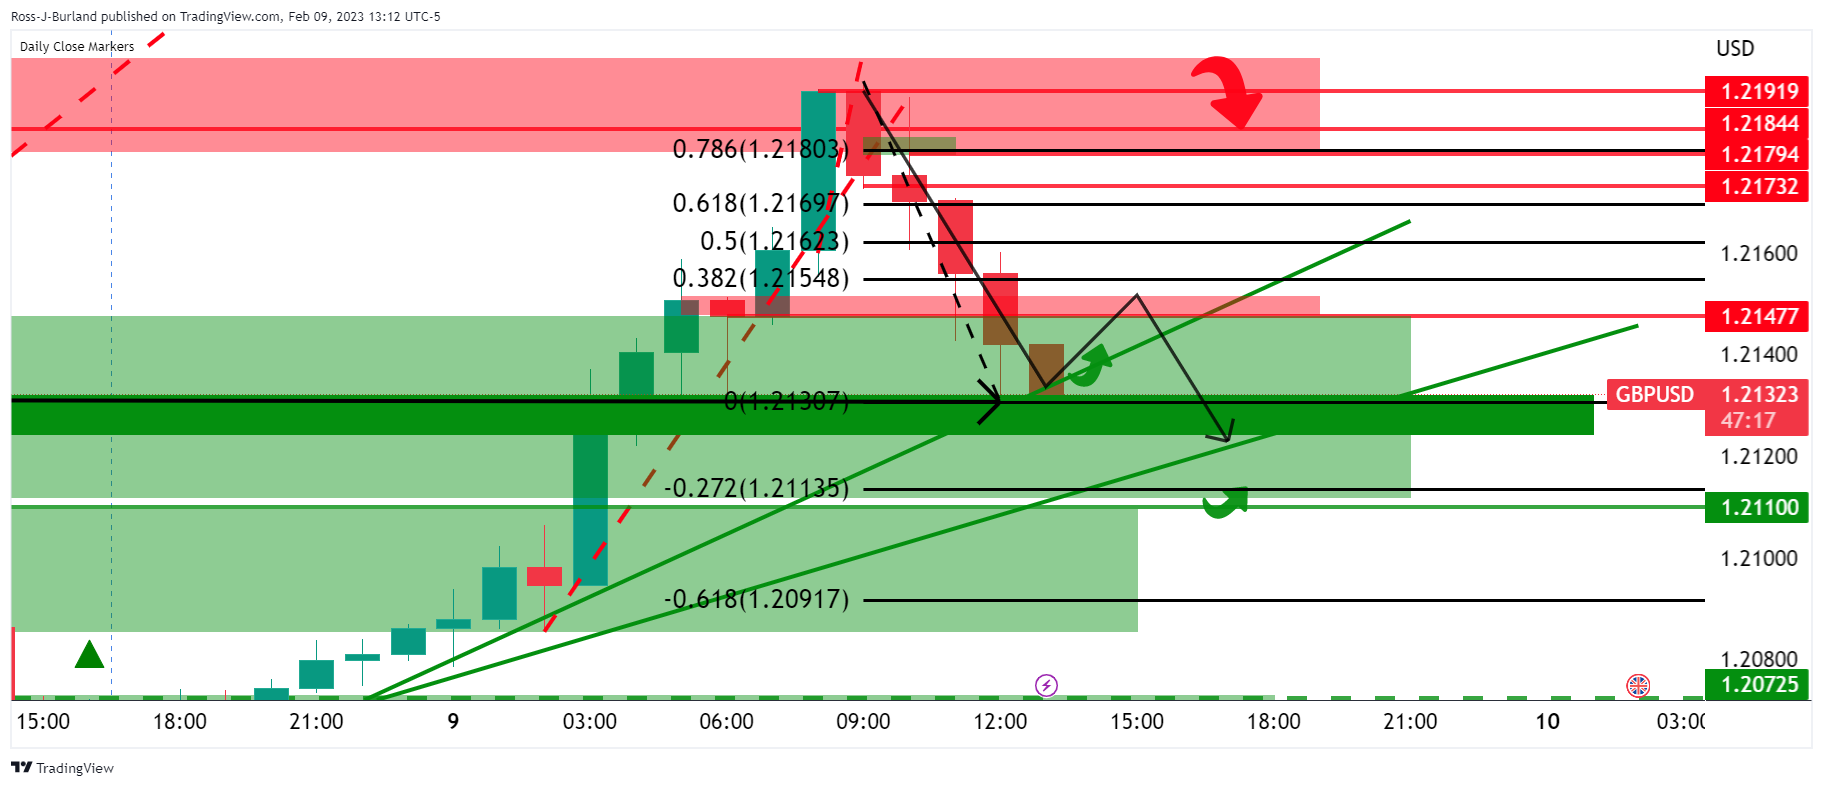
A bullish close on the day will be giving us three bullish closes in a row and leaves the risk of another sell-off on Friday:

The price has already corrected to a 50% mean reversion of the prior bearish daily impulse. 

Author

Ross J Burland

Ross J Burland, born in England, UK, is a sportsman at heart. He played Rugby and Judo for his county, Kent and the South East of England Rugby team.

More from Ross J Burland
Share:

Editor's Picks

EUR/USD eyes nine-day EMA barrier after rebounding from 1.1600

EUR/USD gains ground after registering modest losses in the previous session, trading around 1.1620 during the Asian hours on Friday. The technical analysis of the daily chart suggests an ongoing bearish bias as the pair remains within the descending channel pattern.

GBP/USD: Pound Sterling ticks up against US Dollar in countdown to US NFP

The Pound Sterling trades marginally higher to near 1.3365 against the US Dollar during the Asian trading session on Friday. The GBP/USD pair edges up as the US Dollar ticks down ahead of the United States Nonfarm Payrolls data for February, which will be published at 13:30 GMT.

Gold advances on increased safe-haven demand

Gold price recovers its recent losses from the previous session. The yellow metal advances as the broader precious metals market rebounds on safe-haven demand. However, the yellow metal is on track for its first weekly decline in five weeks as escalating Middle East tensions push oil prices higher, fueling inflation concerns and reducing bets on Federal Reserve rate cuts.

Bitcoin, Ethereum and Ripple at risk as US-Iran war extends

Bitcoin, Ethereum, and Ripple trade cautiously at press time on Friday, close to key support levels after a roughly 2% pullback the previous day. Bitcoin holds above $71,000, Ethereum at $2,000, and XRP continues to consolidate in a sideways range.

The market compass is pointing at a barrel of Oil

The Asian open is arriving with equities leaning the wrong way, and the reason is not complicated. The market’s compass needle has snapped firmly toward crude. In this tape, oil is not just another input price; it is the gravitational center around which every asset class is orbiting.

Top 3 Price Prediction: Bitcoin, Ethereum, Ripple at risk as US-Iran war extends

Bitcoin, Ethereum, and Ripple trade cautiously at press time on Friday, close to key support levels after a roughly 2% pullback the previous day. Bitcoin holds above $71,000, Ethereum at $2,000, and XRP continues to consolidate in a sideways range.