GBP/USD Price Analysis: Retreats from 1.2460 despite BoE preparing for a rate hike
- GBP/USD has retreated after a short-lived pullback to near 1.2460 amid a recovery in the USD Index.
- Stubborn UK inflation is supporting more interest rate hikes from the BoE.
- GBP/USD is auctioning in a Symmetrical Triangle chart pattern that indicates a contraction in volatility.

The GBP/USD pair has sensed selling pressure around 1.2450 in the early European session. The strength in the Cable seems waned as the US Dollar Index (DXY) attempted a recovery after a correction below 104.00
Stubborn United Kingdom inflation is supporting more interest rate hikes from the Bank of England (BoE), which will keep the Pound Sterling in a bullish trajectory.
The USD Index is likely to remain volatile as the odds of a neutral interest rate policy by the Federal Reserve (Fed) have started receding, knowing the fact that the labor market is extremely solid and an absence of recession signals.
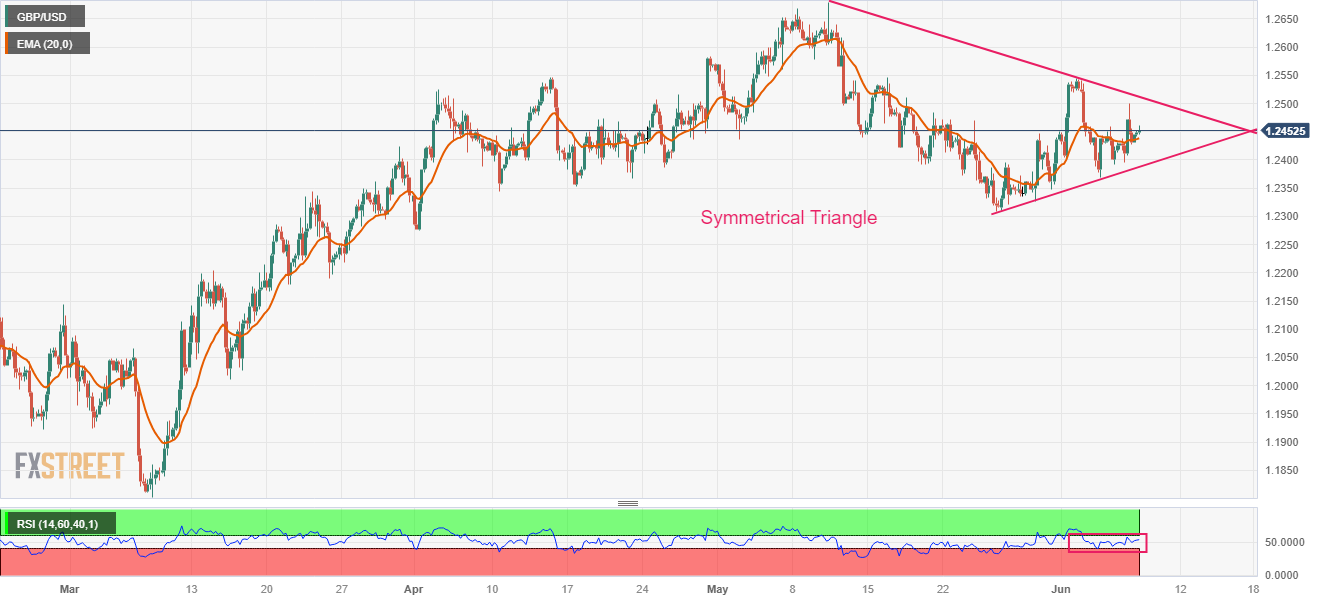
GBP/USD is auctioning in a Symmetrical Triangle chart pattern that indicates a contraction in volatility, which is followed by wider ticks and heavy volume after an explosion. The upward-sloping trendline of the aforementioned chart pattern is plotted from May 25 low at 1.2308 while the downward-sloping trendline is placed from May 10 high at 1.2680.
The 20-period Exponential Moving Average (EMA) at 1.2437 seems sticky to the asset, indicating a sideways performance.
Also, the Relative Strength Index (RSI) (14) has been confined into the 40.00-60.00 range, which signals that investors are awaiting a fresh trigger for a decisive move.
Should the asset break below May 31 low at 1.2348, US Dollar bulls would drag the asset toward May 25 low at 1.2308. Slippage below the latter would expose the asset to April 03 low at 1.2275.
On the flip side, a confident break above May 16 high at 1.2547 will drive the Cable towards May 10 low at 1.2603 followed by May 10 high at 1.2680.
GBP/USD four-hour chart
Author

Sagar Dua
FXStreet
Sagar Dua is associated with the financial markets from his college days. Along with pursuing post-graduation in Commerce in 2014, he started his markets training with chart analysis.


