GBP/USD Price Analysis: Remains close to over two-month peak, bullish potential intact


  • GBP/USD attracts fresh buying on Wednesday amid the underlying USD bearish tone.
  • Divergent Fed-BoE policy expectations turn out to be another factor lending support.
  • The technical setup favors bullish traders and supports prospects for additional gains.

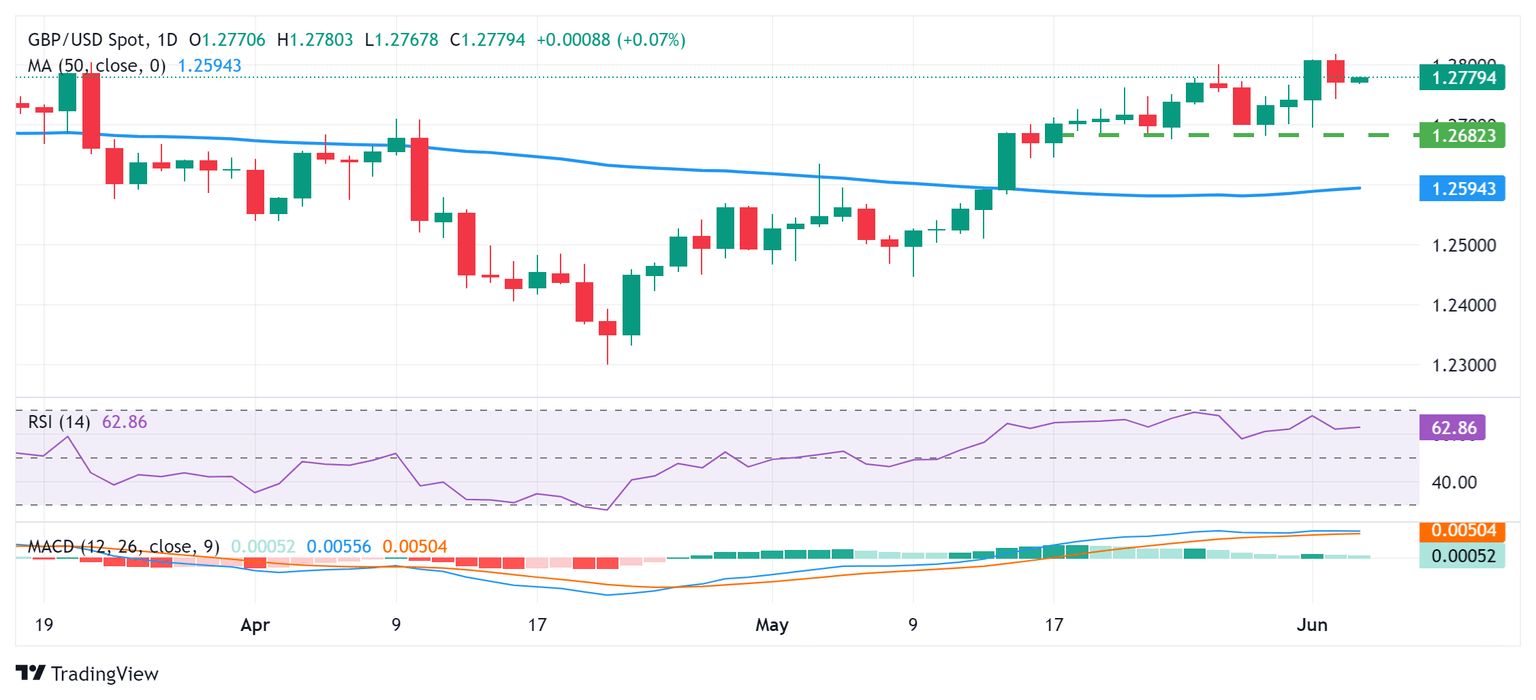
The GBP/USD pair trades with a mild positive bias around the 1.2775-1.2780 area during the Asian session on Wednesday and remains well within the striking distance of its highest level since March 14 touched the previous day.

The US Dollar (USD) struggles to capitalize on the overnight bounce from over a two-month low in the wake of rising bets for an imminent interest rate cut by the Federal Reserve (Fed) later this year. Furthermore, expectations that the Bank of England (BoE) might keep interest rates at their current level for a little bit longer continue to underpin the British Pound (GBP) and act as a tailwind for the GBP/USD pair. 

From a technical perspective, oscillators on the daily chart are holding in the positive territory and are still away from being in the overbought zone. This, in turn, supports prospects for further gains. Some follow-through buying beyond the 1.2800 mark will reaffirm the positive bias and lift the GBP/USD pair to the 1.2855-1.2860 area en route to the 1.2900 neighborhood or the YTD peak touched in March.

On the flip side, the overnight swing low, around the 1.2745-1.2740 region, now seems to protect the immediate downside ahead of the 1.2725-1.2720 area. The latter is followed by the 1.2700 mark, which if broken should pave the way for a slide towards the next relevant support near mid-1.2600s. Spot prices might eventually drop to test sub-1.2600 levels, or the 50-day Simple Moving Average (SMA) support.

GBP/USD daily chart

fxsoriginal

GBP/USD

Overview
Today last price 1.278
Today Daily Change 0.0009
Today Daily Change % 0.07
Today daily open 1.2771
 
Trends
Daily SMA20 1.268
Daily SMA50 1.2592
Daily SMA100 1.2636
Daily SMA200 1.2544
 
Levels
Previous Daily High 1.2818
Previous Daily Low 1.2743
Previous Weekly High 1.2801
Previous Weekly Low 1.2681
Previous Monthly High 1.2801
Previous Monthly Low 1.2446
Daily Fibonacci 38.2% 1.2772
Daily Fibonacci 61.8% 1.2789
Daily Pivot Point S1 1.2736
Daily Pivot Point S2 1.2702
Daily Pivot Point S3 1.2662
Daily Pivot Point R1 1.2811
Daily Pivot Point R2 1.2852
Daily Pivot Point R3 1.2886


Share: Feed news

Information on these pages contains forward-looking statements that involve risks and uncertainties. Markets and instruments profiled on this page are for informational purposes only and should not in any way come across as a recommendation to buy or sell in these assets. You should do your own thorough research before making any investment decisions. FXStreet does not in any way guarantee that this information is free from mistakes, errors, or material misstatements. It also does not guarantee that this information is of a timely nature. Investing in Open Markets involves a great deal of risk, including the loss of all or a portion of your investment, as well as emotional distress. All risks, losses and costs associated with investing, including total loss of principal, are your responsibility. The views and opinions expressed in this article are those of the authors and do not necessarily reflect the official policy or position of FXStreet nor its advertisers. The author will not be held responsible for information that is found at the end of links posted on this page.

If not otherwise explicitly mentioned in the body of the article, at the time of writing, the author has no position in any stock mentioned in this article and no business relationship with any company mentioned. The author has not received compensation for writing this article, other than from FXStreet.

FXStreet and the author do not provide personalized recommendations. The author makes no representations as to the accuracy, completeness, or suitability of this information. FXStreet and the author will not be liable for any errors, omissions or any losses, injuries or damages arising from this information and its display or use. Errors and omissions excepted.

The author and FXStreet are not registered investment advisors and nothing in this article is intended to be investment advice.

XM
Account
7.2
Tools
9.2
Service
9.4
Trading
9.0
Trust
7.0
Experience
8.4
Read review
Moneta Markets
Account
7.4
Tools
6.6
Service
8.0
Trading
6.6
Trust
5.2
Experience
9.2
Read review
Trading Pro
Account
7.2
Tools
5.2
Service
6.6
Trading
8.0
Trust
5.0
Experience
7.0
Read review
Pepperstone
Account
8.2
Tools
8.2
Service
7.4
Trading
9.0
Trust
8.8
Experience
9.0
Read review
XM
Read review
Moneta Markets
Read review
Trading Pro
Read review
Pepperstone
Read review
Trading Pro
Read review
Pepperstone
Read review
XM
Read review
Moneta Markets
Read review
Trading Pro
Account
7.2
Tools
5.2
Service
6.6
Trading
8.0
Trust
5.0
Experience
7.0
Read review
Pepperstone
Account
8.2
Tools
8.2
Service
7.4
Trading
9.0
Trust
8.8
Experience
9.0
Read review
XM
Account
7.2
Tools
9.2
Service
9.4
Trading
9.0
Trust
7.0
Experience
8.4
Read review
Moneta Markets
Account
7.4
Tools
6.6
Service
8.0
Trading
6.6
Trust
5.2
Experience
9.2
Read review

Recommended content


Recommended content

Editors’ Picks

EUR/USD regains traction and retargets 1.1000

EUR/USD regains traction and retargets 1.1000

The US Dollar accelerates its decline in the epilogue of the NA session on Tuesday, lending broad support to the risk-linked space and sending EUR/USD to the 1.0980 region, near daily peaks.

EUR/USD News
GBP/USD challenges daily tops around 1.2800

GBP/USD challenges daily tops around 1.2800

GBP/USD maintains its renewed bullish stance on Tuesday, trading at shouting distance from the key resistance at 1.2800 the figure on the back of the marked losses in the Greenback.

GBP/USD News
Gold erases gains, back to the $2,980 zone

Gold erases gains, back to the $2,980 zone

Gold prices now lose extra ground and slip back to the area of daily troughs near $2,980 mark per troy ounce following an unsuccesful attempt to maintain the trade above the critical $3,000 level earlier in the day.

Gold News
Who is Satoshi? Crypto lawyer sues DHS to reveal Satoshi Nakamoto's identity

Who is Satoshi? Crypto lawyer sues DHS to reveal Satoshi Nakamoto's identity

James Murphy, a cryptocurrency lawyer popularly known to his followers on X as "MetalLawMan," has filed a lawsuit in a D.C. District Court against the Department of Homeland Security (DHS). He intends to uncover the real face or faces behind Satoshi Nakamoto, the pseudonymous creator of Bitcoin. 

Read more
The Fed is looking at a hefty price level

The Fed is looking at a hefty price level

We are still in thrall to tariffs, the faux-macro “data” driving markets. The WSJ editorial board advised other countries to take their tariffs to zero so that Trump’s “reciprocal” tariffs will have to be zero, too. Cute, but no cigar.

Read more
The Best brokers to trade EUR/USD

The Best brokers to trade EUR/USD

SPONSORED Discover the top brokers for trading EUR/USD in 2025. Our list features brokers with competitive spreads, fast execution, and powerful platforms. Whether you're a beginner or an expert, find the right partner to navigate the dynamic Forex market.

Read More

Forex MAJORS

Cryptocurrencies

Signatures

Best Brokers of 2025