GBP/USD Price Analysis: Refreshes 12-day top but rising wedge on 4H probes the bulls
- GBP/USD prints three-day winning streak to probe September 18 top surrounding 1.3000.
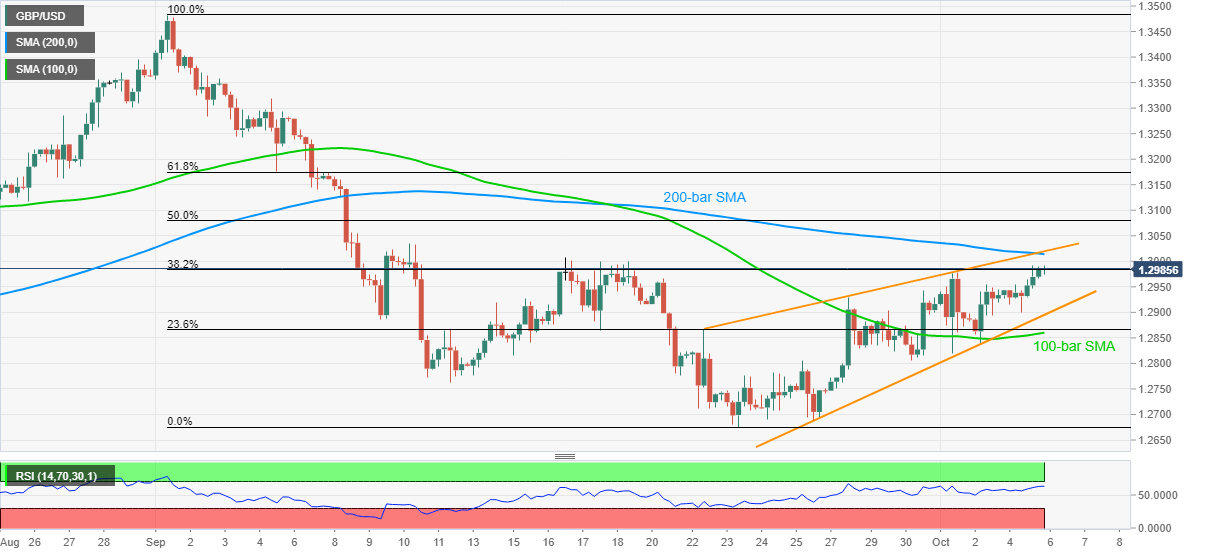
- Resistance line of the bearish chart pattern, 200-bar SMA will be a tough nut to crack for the buyers.
- 100-bar SMA adds to the downside support below rising wedge’s lower line.

GBP/USD rises to the highest in more than two weeks while trading around 1.2985, the intraday top being 1.2992, during the early Tuesday morning in Asia. In doing so, the Cable attacks 38.2% Fibonacci retracement of the September month’s downside amid upbeat RSI conditions.
However, a bearish chart pattern, the rising wedge, on the four-hour chart (4H) challenges the GBP/USD buyers above the 1.3000 threshold.
Other than the upper line of the sellers’ favorite chart play, 200-bar SMA also adds strength to the 1.3015/20 resistance confluence.
If at all the pair manages to cross 1.3020, the September 10 high near 1.3035 and 61.8% Fibonacci retracement around 1.3175 will be the key to watch.
Alternatively, a downside break of the rising wedge support, at 1.2895 now, needs confirmation from a 100-bar SMA level of 1.2860 before challenging the previous month’s low of 1.2675.
GBP/USD four-hour chart
Trend: Pullback expected
Author

Anil Panchal
FXStreet
Anil Panchal has nearly 15 years of experience in tracking financial markets. With a keen interest in macroeconomics, Anil aptly tracks global news/updates and stays well-informed about the global financial moves and their implications.


