GBP/USD Price Analysis: More downside seems warranted amid a breakdown below 1.2400


Share:
  • GBP/USD has delivered a breakdown below 1.2400 as investors get hopeful for a hawkish Fed policy post robust US NFP.
  • Considering the persistence of UK inflation, the BoE might fail to halve inflation by year-end as promised by UK PM Rishi Sunak.
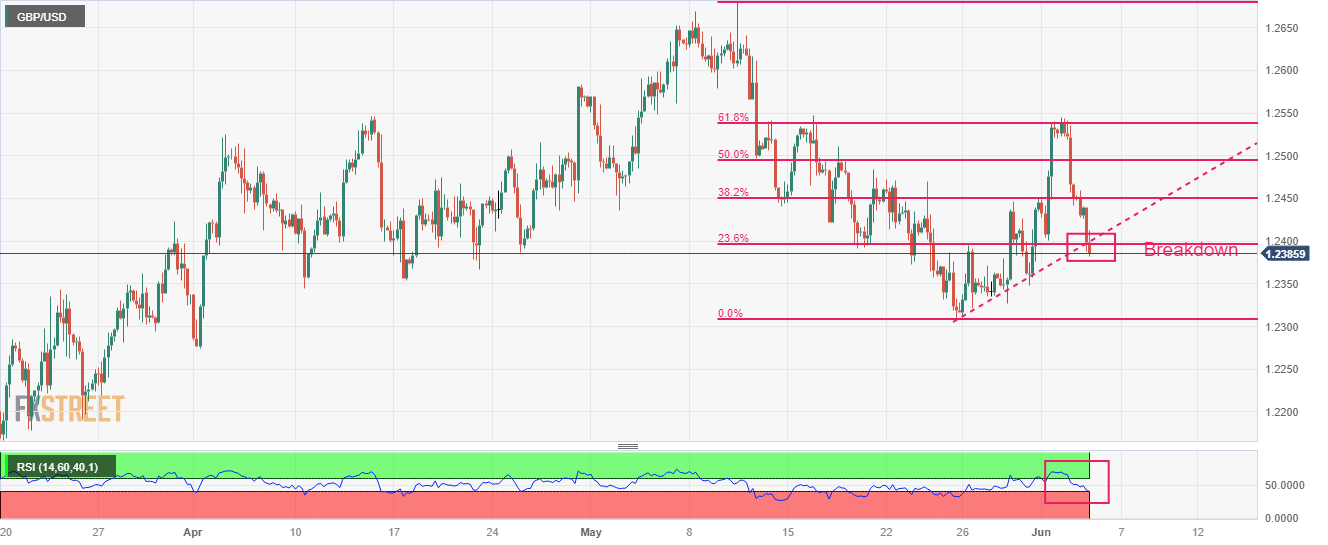
  • GBP/USD witnessed intense selling pressure after failing to surpass the 61.8% Fibo retracement at 1.2583.

The GBP/USD pair has slipped sharply below the round-level support of 1.2400 in the European session. The Cable is facing immense selling pressure as the US Dollar has been strengthened after robust payroll additions in the United States in May fetched interest rate hike bets into the picture.

Additions of fresh Employment in May were extremely solid despite the Federal Reserve (Fed) consistently raising interest rates and US regional banks have inculcated more filters into their credit disbursement mechanism to maintain their asset quality amid a turbulent environment.

The Pound Sterling is failing in holding its feet despite the Bank of England (BoE) being expected to raise interest rates further amid a tight labor market and persistent food inflation. Considering the persistence in United Kingdom inflation, BoE Governor Andrew Bailey might fail to halve inflation by year-end as promised by UK Prime Minister Rishi Sunak.

GBP/USD witnessed intense selling pressure after failing to surpass the 61.8% Fibonacci retracement (plotted from May 10 high at 1.2680 to May 25 low at 1.2308) at 1.2583. At the press time, the Cable dropped below the 23.6% Fibo retracement at around 1.2400. The asset has also surrendered the support from the upward-sloping trendline placed from May 25 low at 1.2308.

The Relative Strength Index (RSI) (14) is hovering near 40.00. A breakdown below the same would activate the bearish momentum.

Should the asset break below May 31 low at 1.2348, US Dollar bulls would drag the asset toward May 25 low at 1.2308. Slippage below the latter would expose the asset to April 03 low at 1.2275.

On the flip side, a confident break above May 16 high at 1.2547 will drive the Cable towards May 10 low at 1.2603 followed by May 10 high at 1.2680.

GBP/USD four-hour chart

GBP/USD

Overview
Today last price 1.2389
Today Daily Change -0.0061
Today Daily Change % -0.49
Today daily open 1.245
 
Trends
Daily SMA20 1.2463
Daily SMA50 1.2453
Daily SMA100 1.23
Daily SMA200 1.1994
 
Levels
Previous Daily High 1.2545
Previous Daily Low 1.2442
Previous Weekly High 1.2545
Previous Weekly Low 1.2327
Previous Monthly High 1.268
Previous Monthly Low 1.2308
Daily Fibonacci 38.2% 1.2481
Daily Fibonacci 61.8% 1.2505
Daily Pivot Point S1 1.2413
Daily Pivot Point S2 1.2376
Daily Pivot Point S3 1.2309
Daily Pivot Point R1 1.2516
Daily Pivot Point R2 1.2582
Daily Pivot Point R3 1.2619


Share: Feed news

Information on these pages contains forward-looking statements that involve risks and uncertainties. Markets and instruments profiled on this page are for informational purposes only and should not in any way come across as a recommendation to buy or sell in these assets. You should do your own thorough research before making any investment decisions. FXStreet does not in any way guarantee that this information is free from mistakes, errors, or material misstatements. It also does not guarantee that this information is of a timely nature. Investing in Open Markets involves a great deal of risk, including the loss of all or a portion of your investment, as well as emotional distress. All risks, losses and costs associated with investing, including total loss of principal, are your responsibility. The views and opinions expressed in this article are those of the authors and do not necessarily reflect the official policy or position of FXStreet nor its advertisers. The author will not be held responsible for information that is found at the end of links posted on this page.

If not otherwise explicitly mentioned in the body of the article, at the time of writing, the author has no position in any stock mentioned in this article and no business relationship with any company mentioned. The author has not received compensation for writing this article, other than from FXStreet.

FXStreet and the author do not provide personalized recommendations. The author makes no representations as to the accuracy, completeness, or suitability of this information. FXStreet and the author will not be liable for any errors, omissions or any losses, injuries or damages arising from this information and its display or use. Errors and omissions excepted.

The author and FXStreet are not registered investment advisors and nothing in this article is intended to be investment advice.

Follow us on Telegram

Stay updated of all the news

Join Telegram

Recommended content


Follow us on Telegram

Stay updated of all the news

Join Telegram

Recommended content

Editors’ Picks

EUR/USD loses traction, retreats below 1.0600

EUR/USD loses traction, retreats below 1.0600

EUR/USD lost its recovery momentum and declined below 1.0600 in the American session on Friday, erasing a portion of its daily gains in the process. Nevertheless, the risk-positive market atmosphere after PCE inflation data helps the pair limit its losses.

EUR/USD News

GBP/USD turns negative on the day below 1.2200

GBP/USD turns negative on the day below 1.2200

GBP/USD reversed its direction and slumped below 1.2200 in the American session on Friday after rising above 1.2270 earlier in the day. Position readjustments and profit-taking on the last trading day of the quarter seems to be weighing on Pound Sterling.

GBP/USD News

Gold reverses direction, drops below $1,860

Gold reverses direction, drops below $1,860

Following a steady rebound toward $1,880 on Friday, Gold price made a sharp U-turn and turned negative on the day near $1,860. Although the 10-year US T-bond yield is down more than 1%, XAU/USD struggles to find demand on the last day of Q3.

Gold News

Polkadot Price Forecast: DOT reversal seems inevitable after 92% correction from all-time high

Polkadot Price Forecast: DOT reversal seems inevitable after 92% correction from all-time high

Polkadot price, in nearly two years, has shed 92.91% from its all-time high of $55.09. The massive downswing in DOT has pushed it down to levels that were last seen in October 2020. Hence, the chances of this altcoin forming a bottom and rallying are high. 

Read more

Earnings beat triggers Nike to spike 9%

Earnings beat triggers Nike to spike 9%

Nike (NKE) stock has surged over 9% in Friday’s premarket, climbing above $98 per share, following late Thursday’s fiscal first-quarter earnings release. Nike beat pessimistic earnings expectations by more than 23% and hiked its dividend by 9%.

Read more

Forex MAJORS

Cryptocurrencies

Signatures