|

GBP/USD Price Analysis: Keeps the red below 1.3100 mark, downside seems limited

  • GBP/USD witnessed a modest pullback from resistance marked by 61.8% Fibo. level.
  • Prospects for the emergence of some dip-buying should help any meaningful slide.

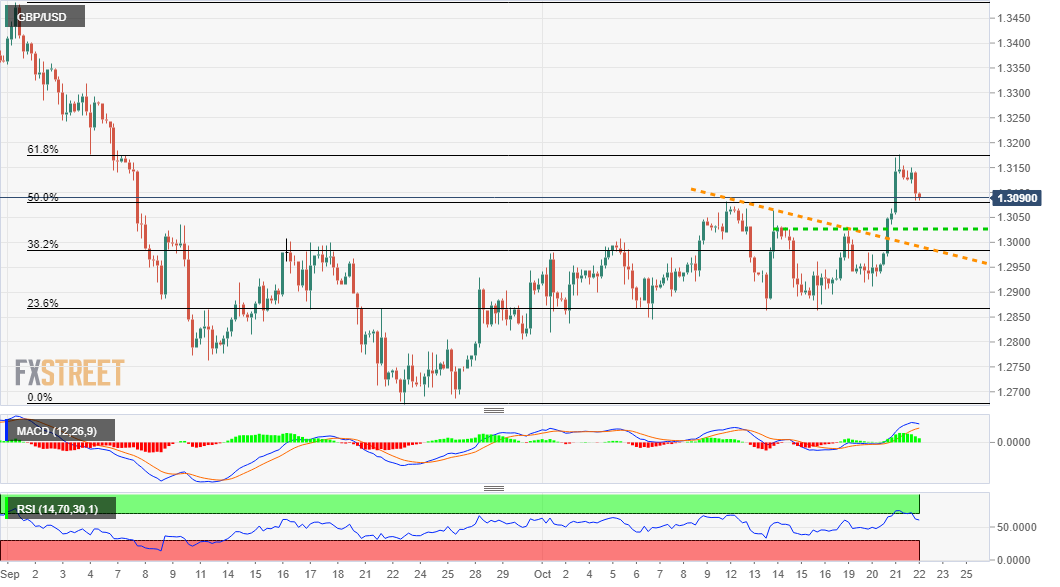
The GBP/USD pair maintained its offered tone through the early North American session and was last seen trading near the lower end of its daily trading range, below the 1.3100 mark. The intraday downtick, so far, has managed to find decent support near the 50% Fibonacci level of the 1.3482-1.2676 recent slide.

Given the overnight breakthrough a one-week-old descending trend-line resistance, the bias remains tilted in favour of bullish traders. The constructive outlook is further reinforced by the fact that oscillators on the daily chart maintained their bullish bias and have also eased from the overbought territory on the 4-hourly chart.

That said, it will still be prudent to wait for some follow-through buying beyond the overnight swing high, around the 1.3175 region, which coincides with the 61.8% Fibo. level, before positioning for any further appreciating move. The GBP/USD pair might then aim to surpass the 1.3200 mark and test the 1.3235 resistance zone.

On the flip side, any further slide below the 50% Fibo. level might still be seen as an opportunity to initiate fresh bullish positions amid the latest optimism over the resumption of Brexit talks. This, in turn, should help limit the downside near the 1.3030-25 horizontal support, which is followed by the key 1.3000 psychological mark.

The latter marks the mentioned trend-line resistance breakpoint and should now act as a strong base for the GBP/USD pair. Failure to defend the mentioned support levels will negate any prospects for any further near-term appreciating move, instead prompt some aggressive technical selling amid resurgent USD demand.

GBP/USD 4-hourly chart

fxsoriginal

Technical levels to watch

GBP/USD

Overview
Today last price1.3098
Today Daily Change-0.0052
Today Daily Change %-0.40
Today daily open1.315
 
Trends
Daily SMA201.2929
Daily SMA501.3015
Daily SMA1001.2851
Daily SMA2001.271
 
Levels
Previous Daily High1.3177
Previous Daily Low1.294
Previous Weekly High1.3083
Previous Weekly Low1.2863
Previous Monthly High1.3482
Previous Monthly Low1.2676
Daily Fibonacci 38.2%1.3086
Daily Fibonacci 61.8%1.303
Daily Pivot Point S11.3001
Daily Pivot Point S21.2851
Daily Pivot Point S31.2763
Daily Pivot Point R11.3238
Daily Pivot Point R21.3326
Daily Pivot Point R31.3475

Author

Haresh Menghani

Haresh Menghani is a detail-oriented professional with 10+ years of extensive experience in analysing the global financial markets.

More from Haresh Menghani
Share:

Editor's Picks

EUR/USD treads water above 1.1850 amid thin trading

EUR/USD stays defensive but holds 1.1850 amid quiet markets in the European hours on Monday.  The US Dollar is struggling for direction due to thin liquidity conditions as US markets are closed in observance of Presidents' Day. 

GBP/USD flat lines as traders await key UK and US macro data

GBP/USD kicks off a new week on a subdued note and oscillates in a narrow range near 1.365 in Monday's European trading. The mixed fundamental backdrop warrants some caution for aggressive traders as the market focus now shifts to this week's important releases from the UK and the US.

Gold sticks to intraday losses; lacks follow-through

Gold remains depressed through the early European session on Monday, though it has managed to rebound from the daily trough and currently trades around the $5,000 psychological mark. Moreover, a combination of supporting factors warrants some caution for aggressive bearish traders, and before positioning for deeper losses.

Bitcoin, Ethereum and Ripple consolidate within key ranges as selling pressure eases

Bitcoin and Ethereum prices have been trading sideways within key ranges following the massive correction. Meanwhile, XRP recovers slightly, breaking above the key resistance zone. The top three cryptocurrencies hint at a potential short-term recovery, with momentum indicators showing fading bearish signs.

Global inflation watch: Signs of cooling services inflation

Realized inflation landed close to expectations in January, as negative base effects weighed on the annual rates. Remaining sticky inflation is largely explained by services, while tariff-driven goods inflation remains limited even in the US.

Ripple Price Forecast: XRP potential bottom could be in sight

Ripple edges up above the intraday low of $1.35 at the time of writing on Friday amid mixed price actions across the crypto market. The remittance token failed to hold support at $1.40 the previous day, reflecting risk-off sentiment amid a decline in retail and institutional sentiment.