GBP/USD Price Analysis: Keeps the red around mid-1.2200s, downside remains cushioned
- GBP/USD comes under some selling pressure on Tuesday and snaps a three-day winning streak.
- The downside remains limited amid sustained USD selling and ahead of the FOMC/BoE meetings.
- The technical setup still favours bulls and supports prospects for the emergence of dip-buying.

The GBP/USD pair stalls a three-day-old uptrend on Tuesday and retreats from its highest level since early February touched the previous day. The pair maintains its offered tone through the early North American session and is currently placed just below the mid-1.2200s, though lacks follow-through.
The pullback could be attributed to some repositioning trade ahead of this week's key central bank event risks - the crucial FOMC policy decision on Wednesday, followed by the Bank of England (BoE) meeting on Thursday. In the meantime, the prospects for a less hawkish Federal Reserve (Fed), along with a strong follow-through rally in the equity markets, drag the safe-haven US Dollar (USD) to a fresh five-week low and lends support to the GBP/USD pair.
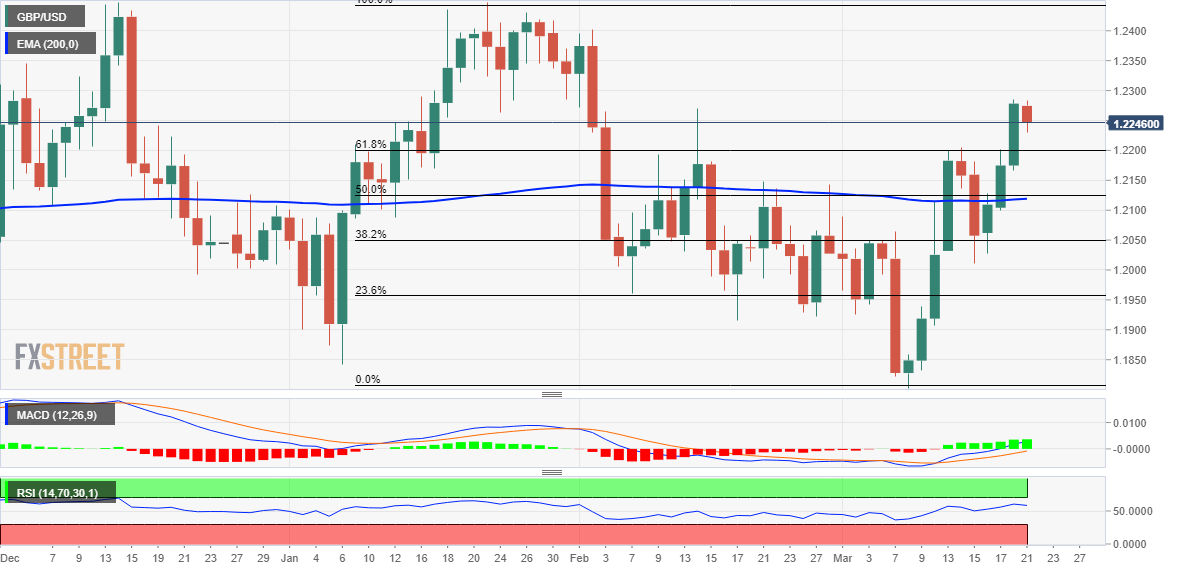
From a technical perspective, the overnight breakout through the 1.2200 mark, or the 61.8% Fibonacci retracement level of the January-March downfall was seen as a fresh trigger for bulls. Moreover, oscillators on the daily chart are holding in positive territory and are still far from being in the overbought zone. This suggests that the path of least resistance for the GBP/USD pair is to the upside and supports prospects for the emergence of some dip-buying at lower levels.
That said, it will still be prudent to wait for some follow-through buying beyond the monthly top, around the 1.2285 region set on Monday, before positioning for any further gains. The GBP/USD pair might then climb to test the next relevant hurdle near the 1.2320 region before eventually aiming to reclaim the 1.2400 round-figure mark. The momentum could get extended further towards the double-top resistance near the 1.2450 region, or the YTD peak touched in January.
On the flip side, 61.8% Fibo. level, around the 1.2200 mark, now seems to protect the immediate downside. Sustained weakness below might prompt some technical selling and drag the GBP/USD pair towards the 1.2125 confluence support. The latter comprises 50% Fibo. level and the 200-day Exponential Moving Average (SMA), which if broken decisively might shift the near-term bias back in favour of bearish traders and pave the way for deeper losses.
GBP/USD daily chart
Key levels to watch
Author

Haresh Menghani
FXStreet
Haresh Menghani is a detail-oriented professional with 10+ years of extensive experience in analysing the global financial markets.


