|

GBP/USD Price Analysis: Extends bounce off 50-SMA towards 1.2330 support-turned-resistance

  • GBP/USD picks up bids to extend week-start recovery moves from short-term key support.
  • 50-SMA, 61.8% Fibonacci retracement level challenge bears amid looming bull cross on the MACD.
  • Rising wedge confirmation keeps Cable sellers hopeful unless the quote stays below 1.2330 previous support.

GBP/USD remains on the front foot as bulls attack the 1.2300 mark during Tuesday’s Asian session, following an upbeat start of the week.

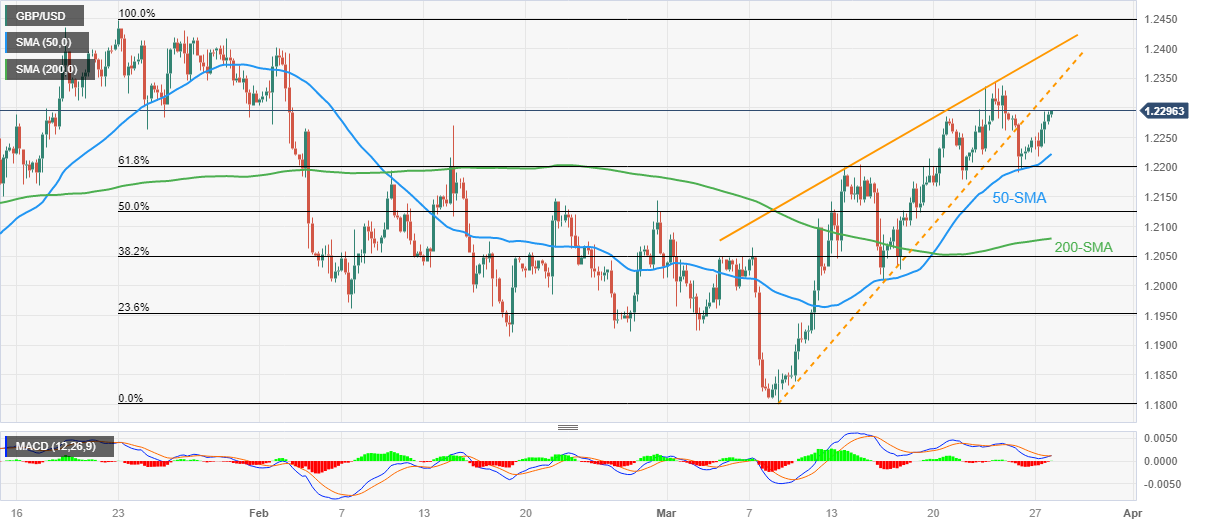
In doing so, the Cable pair stretches the previous run-up from the 50-bar Simple Moving Average (SMA) and the 61.8% Fibonacci retracement level of the quote’s January-March downside. Adding strength to the upside bias could be the impending bulls cross on the MACD.

However, the previous week’s confirmation of the rising wedge bearish chart pattern keeps the Cable pair sellers hopeful unless the quote stays below the previous support line of the wedge, near 1.2330 by the press time.

Following that, the stated wedge’s top line near the 1.2400 round figure and multiple hurdles near the 1.2420-25 area can test the GBP/USD pair’s further upside ahead of directing it to the Year-To-Date (YTD) top surrounding 1.2450.

On the flip side, the 50-SMA and the aforementioned key Fibonacci ratio can challenge short-term GBP/USD bears around 1.2220 and 1.2200 respectively.

In a case where the Cable pair remains bearish past 1.2200, the 50% Fibonacci retracement and 200-SMA can test the downside moves around 1.2125 and 1.2080 in that order before directing bears towards the 1.2000 psychological magnet.

It should be noted that multiple supports near 1.1920 act as the last defense of the GBP/USD buyers.

GBP/USD: Four-hour chart

Trend: Further upside expected

Additional important levels

Overview
Today last price1.2292
Today Daily Change0.0059
Today Daily Change %0.48%
Today daily open1.2233
 
Trends
Daily SMA201.2085
Daily SMA501.2148
Daily SMA1001.2093
Daily SMA2001.1893
 
Levels
Previous Daily High1.2292
Previous Daily Low1.2191
Previous Weekly High1.2344
Previous Weekly Low1.2167
Previous Monthly High1.2402
Previous Monthly Low1.1915
Daily Fibonacci 38.2%1.223
Daily Fibonacci 61.8%1.2253
Daily Pivot Point S11.2185
Daily Pivot Point S21.2137
Daily Pivot Point S31.2083
Daily Pivot Point R11.2287
Daily Pivot Point R21.234
Daily Pivot Point R31.2388

Author

Anil Panchal

Anil Panchal

FXStreet

Anil Panchal has nearly 15 years of experience in tracking financial markets. With a keen interest in macroeconomics, Anil aptly tracks global news/updates and stays well-informed about the global financial moves and their implications.

More from Anil Panchal
Share:

Markets move fast. We move first.

Orange Juice Newsletter brings you expert driven insights - not headlines. Every day on your inbox.

By subscribing you agree to our Terms and conditions.

Editor's Picks

EUR/USD recovers to 1.1750 region as 2025 draws to a close

Following the bearish action seen in the European session on Wednesday, EUR/USD regains its traction and recovery to the 1.1750 region. Nevertheless, the pair's volatility remains low as trading conditions thin out on the last day of the year.

GBP/USD stays weak near 1.3450 on modest USD recovery

GBP/USD remains under modest beairsh pressure and fluctuates at around 1.3450 on Wednesday. The US Dollar finds fresh demand due to the end-of-the-year position adjustments, weighing on the pair amid the pre-New Year trading lull. 

Gold retreats to $4,300 area, looks to post monthly gains

Gold stays on the back foot on the last day of 2025 and trades near $4,300, possibly pressured by profit-taking and position adjustments. Nevertheless, XAU/USD remains on track to post gains for December and extend its winning streak into a fifth consecutive month.

Bitcoin, Ethereum and XRP prepare for a potential New Year rebound

Bitcoin, Ethereum, and Ripple are holding steady on Wednesday after recording minor gains on the previous day. Technically, Bitcoin could extend gains within a triangle pattern while Ethereum and Ripple face critical overhead resistance. 

Economic outlook 2026-2027 in advanced countries: Solidity test

After a year marked by global economic resilience and ending on a note of optimism, 2026 looks promising and could be a year of solid economic performance. In our baseline scenario, we expect most of the supportive factors at work in 2025 to continue to play a role in 2026.

Crypto market outlook for 2026

Year 2025 was volatile, as crypto often is.  Among positive catalysts were favourable regulatory changes in the U.S., rise of Digital Asset Treasuries (DAT), adoption of AI and tokenization of Real-World-Assets (RWA).