|

GBP/USD Price Analysis: Cable retreats towards resistance-turned-support near 1.2000

  • GBP/USD pares the first weekly gain in three as traders brace for the key data/events.
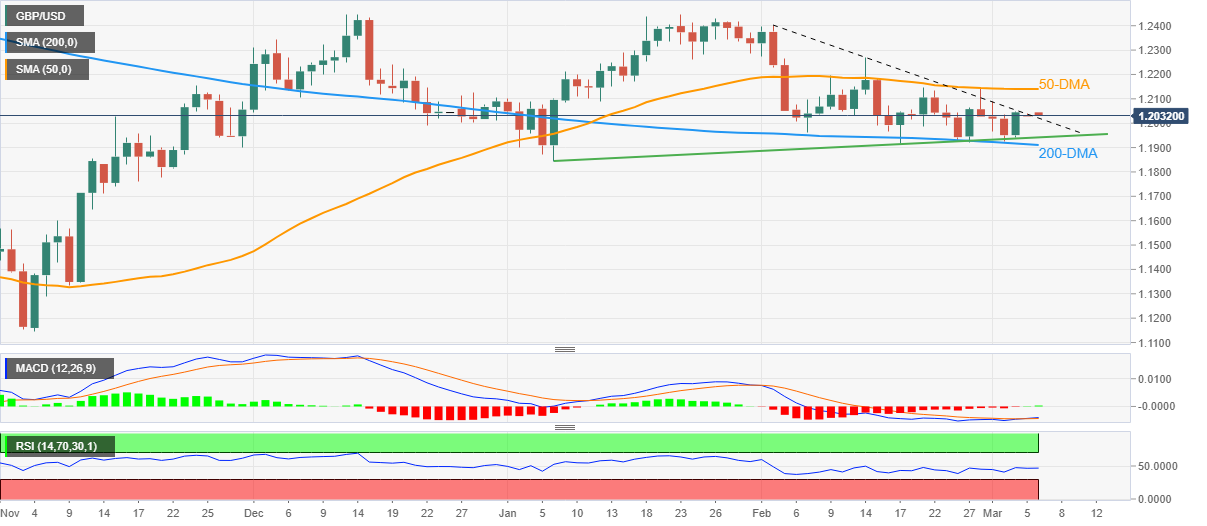
  • Upside break of one-month-old descending trend line, bullish MACD signals favor buyers.
  • Bulls need clear break of 50-DMA to retake control; 200-DMA puts a floor under the Cable price.

GBP/USD bulls take a breather around 1.2030 during Monday’s initial Asian session, after posting the biggest weekly jump since mid-January.

In doing so, the Cable pair fails to extend the previous day’s upside break of the one-month-old descending resistance line, now support around 1.2020.

However, the Cable price is yet to drop back below the resistance-turned-support and the MACD signals are bullish too, which in turn keeps the GBP/USD buyers hopeful amid steady RSI. Adding strength to the upside bias is the quote’s successful trading beyond the 200-DMA.

In addition to the 200-DMA support of around 1.1900, an upward-sloping trend line from early January, close to 1.1940 at the latest, also acts as the short-term key support for the GBP/USD pair.

In a case where the GBP/USD remains bearish past 1.1900, lows marked during January 2023 and late November 2022, respectively near 1.1840 and 1.1760, will be in focus.

On the flip side, a daily closing beyond the 50-DMA hurdle surrounding 1.2140 could quickly propel the Cable pair toward the mid-February swing high surrounding 1.2270.

It’s worth noting, however, that the GBP/USD pair’s successful trading above 1.2270 enables the buyers to aim for the 2.5-month-old horizontal resistance area nearing 1.2445-50.

GBP/USD: Daily chart

Trend: Limited upside expected

Additional important levels

Overview
Today last price1.2033
Today Daily Change-0.0012
Today Daily Change %-0.10%
Today daily open1.2045
 
Trends
Daily SMA201.2047
Daily SMA501.2141
Daily SMA1001.1985
Daily SMA2001.1916
 
Levels
Previous Daily High1.2049
Previous Daily Low1.1943
Previous Weekly High1.2143
Previous Weekly Low1.1922
Previous Monthly High1.2402
Previous Monthly Low1.1915
Daily Fibonacci 38.2%1.2008
Daily Fibonacci 61.8%1.1983
Daily Pivot Point S11.1975
Daily Pivot Point S21.1906
Daily Pivot Point S31.1869
Daily Pivot Point R11.2081
Daily Pivot Point R21.2118
Daily Pivot Point R31.2188

Author

Anil Panchal

Anil Panchal

FXStreet

Anil Panchal has nearly 15 years of experience in tracking financial markets. With a keen interest in macroeconomics, Anil aptly tracks global news/updates and stays well-informed about the global financial moves and their implications.

More from Anil Panchal
Share:

Markets move fast. We move first.

Orange Juice Newsletter brings you expert driven insights - not headlines. Every day on your inbox.

By subscribing you agree to our Terms and conditions.

Editor's Picks

EUR/USD: Bulls pray for a dovish Fed

EUR/USD has finally taken a breather after a pretty energetic climb. The pair broke above 1.1680 in the second half of the week, reaching its highest levels in around two months before running into some selling pressure. Even so, it has gained almost two cents from the late-November dip just below 1.1500 the figure.

GBP/USD trims gains, recedes toward 1.3320

GBP/USD is struggling to keep its daily advance, coming under fresh pressure and retreating to the 1.3320 zone following a mild bullish attempt in the Greenback. Even though US consumer sentiment surprised to the upside, the US Dollar isn’t getting much love, as traders are far more interested in what the Fed will say next week.

Gold: Bullish momentum fades despite broad USD weakness

After rising more than 3.5% in the previous week, Gold has entered a consolidation phase and fluctuated at around $4,200. The Federal Reserve’s interest rate decision and revised Summary of Economic Projections, also known as the dot plot, could trigger the next directional move in XAU/USD. 

Week ahead: Rate cut or market shock? The Fed decides

Fed rate cut widely expected; dot plot and overall meeting rhetoric also matter. Risk appetite is supported by Fed rate cut expectations; cryptos show signs of life. RBA, BoC and SNB also meet; chances of surprises are relatively low. Dollar weakness could linger; both the aussie and the yen best positioned to gain further. Gold and oil eye Ukraine-Russia developments; a peace deal remains elusive.

The Silver disconnection is real

Silver just hit a new all-time high. Neither did gold, nor mining stocks. They all reversed on an intraday basis, but silver’s move to new highs makes it still bullish overall, while the almost complete reversals in gold and miners make the latter technically bearish.

Ripple faces persistent bear risks, shrugging off ETF inflows

Ripple is extending its decline for the second consecutive day, trading at $2.06 at the time of writing on Friday. Sentiment surrounding the cross-border remittance token continues to lag despite steady inflows into XRP spot ETFs.