|

GBP/USD Price Analysis: Cable bulls stall near 1.2600, pullback hinges on UK GDP, Fed

  • GBP/USD retreats from the highest levels in five weeks as UK monthly data dump, Fed decision loom.
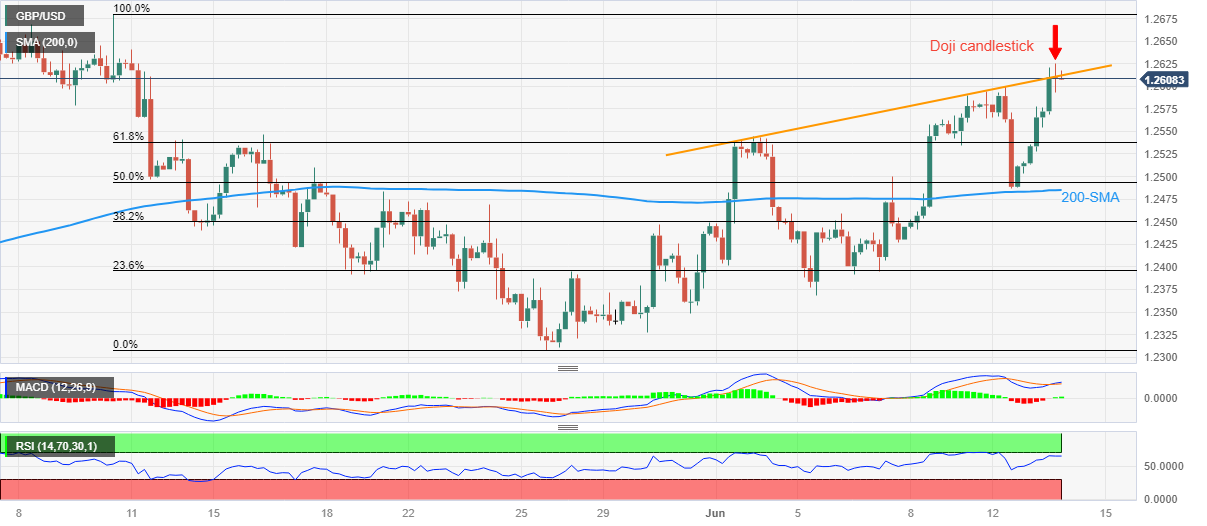
  • Overbought RSI, failure to cross fortnight-old resistance line and Doji candlestick challenge the Cable buyers.
  • Golden Fibonacci ratio, 200-SMA and bullish MACD signals put a floor under the Pound Sterling prices.

GBP/USD fades upside momentum at a multi-day high on the key day comprising the US Federal Reserve (Fed) verdict and the monthly UK data dump. That said, the Cable pair remains dicey near 1.2600 after rising the most in a week to prod the highest level since May 11 the previous day. Apart from the pre-data/event anxiety, the Pound Sterling also justifies the technical clues to tease the sellers on important data.

That said, overbought RSI conditions and an ascending resistance line from June 01, around 1.2615 by the press time, are the first-tier challenges for the GBP/USD bulls. Also restricting the Cable pair’s upside is the Doji candlestick on the four-hour play marked at the multi-day high, suggesting a pullback in prices.

Hence, the quote is likely to consolidate the latest gains, which in turn highlights the 61.8% Fibonacci retracement level of its May month fall, around 1.2535. It’s worth noting that the said technical level is also known as the golden Fibonacci ratio.

In a case where the GBP/USD drops below the said key Fibonacci support, it can fall to the 50% Fibonacci retracement near the 1.2500 round figure.

It should be noted, however, that the bullish MACD may join the 200-SMA level of 1.2485 to challenge the Cable bears afterward.

On the contrary, a clear upside past the latest peak of near 1.2625 could defy the bearish bias and propel the GBP/USD price towards challenging the previous monthly high of around 1.2680.

GBP/USD: Four-hour chart

Trend: Limited downside expected

Additional important levels

Overview
Today last price1.261
Today Daily Change0.0105
Today Daily Change %0.84%
Today daily open1.2505
 
Trends
Daily SMA201.2442
Daily SMA501.2471
Daily SMA1001.231
Daily SMA2001.2021
 
Levels
Previous Daily High1.2599
Previous Daily Low1.2487
Previous Weekly High1.259
Previous Weekly Low1.2369
Previous Monthly High1.268
Previous Monthly Low1.2308
Daily Fibonacci 38.2%1.253
Daily Fibonacci 61.8%1.2557
Daily Pivot Point S11.2462
Daily Pivot Point S21.2418
Daily Pivot Point S31.2349
Daily Pivot Point R11.2574
Daily Pivot Point R21.2643
Daily Pivot Point R31.2686

Author

Anil Panchal

Anil Panchal

FXStreet

Anil Panchal has nearly 15 years of experience in tracking financial markets. With a keen interest in macroeconomics, Anil aptly tracks global news/updates and stays well-informed about the global financial moves and their implications.

More from Anil Panchal
Share:

Editor's Picks

GBP/USD resumes downside below 1.3200

GBP/USD resumes its downside below 1.3200 in European trading on Wednesday. The pair remains vulnerable amid a broadly firmer US Dollar and chaotic UK political environment. The focus is now on BoE-speak for further trading impetus.

EUR/USD sits at yearly low near 1.1350 on USD strength

EUR/USD sits at yearly lows near 1.1350 in the European morning on Wednesday. The pair remains vulnerable to further declines amid a bullish US Dollar. The Greenback continues to draw support from hawkish Fed bets and US-Iran peace deal uncertainty.

Gold: Bears retain control as Fed rate hike bets continue to boost USD

Gold recovers slightly from a nearly two-week low, around the $4,050 region, touched earlier this Wednesday. The commodity, however, sticks to its bearish bias for the second straight day, and seems vulnerable to weaken further amid sustained US Dollar buying.

Dogecoin tests a key make-or-break point amid waning retail support

Dogecoin trades below $0.08000 maintaining a steady decline for the seventh straight week. The meme coin is losing its retail strength as DOGE futures Open Interest drops 10% in 24 hours, while institutional demand remains muted with zero inflows so far this week.

Tech rout weighs on US stocks as the USD clocks a fresh 2026 high

Major US equity benchmarks ended Tuesday’s session considerably in the red, with the Nasdaq 100 down 3.3%, the S&P 500 off by 1.4%, and the Dow Jones down 0.1%. Stocks were largely weighed down by tech amid doubts over the AI-driven rally; the Philadelphia Semiconductor Index slid nearly 8%.

Regime change: Inside Kevin Warsh's first move to make the Fed unreadable on purpose

The rate did not move. That was the least interesting thing about Kevin Warsh's first meeting in charge of the Fed. The FOMC held its benchmark at 3.50%-3.75% for the fourth straight meeting, exactly as priced, and then the new chair used his first press conference to dismantle the machinery the market has leaned on for a decade.