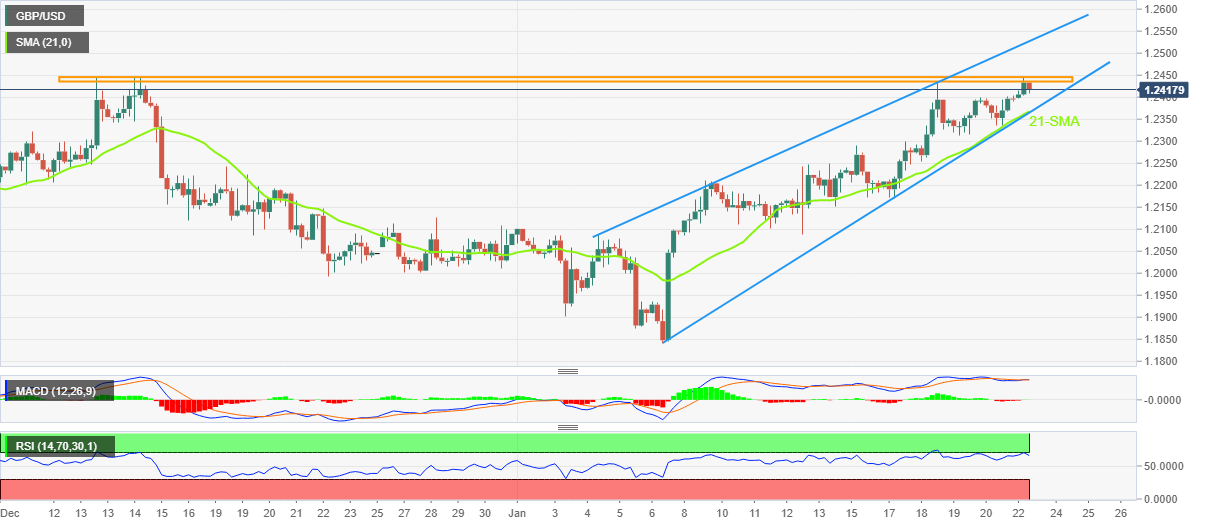
GBP/USD Price Analysis: Bulls retreat from fresh seven-month high near 1.2450 inside rising wedge


  • GBP/USD pares intraday gains after refreshing multi-day top.
  • Overbought RSI, six-week-old horizontal hurdle challenge Cable buyers.
  • 21-SMA adds strength to 1.2365 key support, successful break of 1.2530 will defy rising wedge formation.

GBP/USD struggles to defend the 1.2400 threshold during a five-day uptrend to Monday’s European session, after rising to the highest levels since June 2022 earlier in the day.

In doing so, the Cable pair eases from the six-week-old horizontal resistance surrounding 1.2450 as the RSI (14) hits the overbought territory.

In addition to the quote’s repeated failures to cross the 1.2450 hurdle and the overbought RSI conditions, a 13-day-old rising wedge bearish chart formation also teases the GBP/USD bears around the multi-day top.

However, the 21-SMA level adds strength to the 1.2365 support, a break of which will confirm the rising wedge bearish pattern.

Following that, the 1.2100 and the 1.2000 round figures may entertain the GBP/USD bears during the theoretical south-run targeting the 1.1800 levels.

It should be noted that the sluggish MACD signals challenge the pair’s intraday momentum and hence restrict the bear’s entry.

On the contrary, successful trading beyond the 1.2450 hurdle isn’t an open invitation to the GBP/USD bulls as the stated wedge’s top line, near 1. 2530 by the press time, will act as an additional upside filter for the pair.

In a case where the GBP/USD remains firmer past 1.2530, a run-up towards May 2022 high near 1.2665 can’t be ruled out.

GBP/USD: Four-hour chart

Trend: Limited upside expected

Additional important levels

Overview
Today last price 1.2413
Today Daily Change 0.0018
Today Daily Change % 0.15%
Today daily open 1.2395
 
Trends
Daily SMA20 1.2143
Daily SMA50 1.211
Daily SMA100 1.1724
Daily SMA200 1.1978
 
Levels
Previous Daily High 1.2404
Previous Daily Low 1.2335
Previous Weekly High 1.2436
Previous Weekly Low 1.2169
Previous Monthly High 1.2447
Previous Monthly Low 1.1992
Daily Fibonacci 38.2% 1.2378
Daily Fibonacci 61.8% 1.2362
Daily Pivot Point S1 1.2352
Daily Pivot Point S2 1.2309
Daily Pivot Point S3 1.2283
Daily Pivot Point R1 1.2421
Daily Pivot Point R2 1.2447
Daily Pivot Point R3 1.249


Share: Feed news

Information on these pages contains forward-looking statements that involve risks and uncertainties. Markets and instruments profiled on this page are for informational purposes only and should not in any way come across as a recommendation to buy or sell in these assets. You should do your own thorough research before making any investment decisions. FXStreet does not in any way guarantee that this information is free from mistakes, errors, or material misstatements. It also does not guarantee that this information is of a timely nature. Investing in Open Markets involves a great deal of risk, including the loss of all or a portion of your investment, as well as emotional distress. All risks, losses and costs associated with investing, including total loss of principal, are your responsibility. The views and opinions expressed in this article are those of the authors and do not necessarily reflect the official policy or position of FXStreet nor its advertisers. The author will not be held responsible for information that is found at the end of links posted on this page.

If not otherwise explicitly mentioned in the body of the article, at the time of writing, the author has no position in any stock mentioned in this article and no business relationship with any company mentioned. The author has not received compensation for writing this article, other than from FXStreet.

FXStreet and the author do not provide personalized recommendations. The author makes no representations as to the accuracy, completeness, or suitability of this information. FXStreet and the author will not be liable for any errors, omissions or any losses, injuries or damages arising from this information and its display or use. Errors and omissions excepted.

The author and FXStreet are not registered investment advisors and nothing in this article is intended to be investment advice.

Recommended content


Recommended content

Editors’ Picks

AUD/USD hovers around 0.6500 amid light trading, ahead of US GDP

AUD/USD hovers around 0.6500 amid light trading, ahead of US GDP

AUD/USD is trading close to 0.6500 in Asian trading on Thursday, lacking a clear directional impetus amid an Anzac Day holiday in Australia. Meanwhile, traders stay cautious due ti risk-aversion and ahead of the key US Q1 GDP release. 

AUD/USD News

USD/JPY finds its highest bids since 1990, near 155.50

USD/JPY finds its highest bids since 1990, near 155.50

USD/JPY keeps breaking into its highest chart territory since June of 1990 early Thursday, testing 155.50 for the first time in 34 years as the Japanese Yen remains vulnerable, despite looming Japanese intervention risks. Focus shifts to Thursday's US GDP report and the BoJ decision on Friday. 

USD/JPY News

Gold price treads water near $2,320, awaits US GDP data

Gold price treads water near $2,320, awaits US GDP data

Gold price recovers losses but keeps its range near $2,320 early Thursday. Renewed weakness in the US Dollar and the US Treasury yields allow Gold buyers to breathe a sigh of relief. Gold price stays vulnerable amid Middle East de-escalation, awaiting US Q1 GDP data. 

Gold News

Injective price weakness persists despite over 5.9 million INJ tokens burned

Injective price weakness persists despite over 5.9 million INJ tokens burned

Injective price is trading with a bearish bias, stuck in the lower section of the market range. The bearish outlook abounds despite the network's deflationary efforts to pump the price. Coupled with broader market gloom, INJ token’s doomed days may not be over yet.

Read more

Meta Platforms Earnings: META sinks 10% on lower Q2 revenue guidance Premium

Meta Platforms Earnings: META sinks 10% on lower Q2 revenue guidance

This must be "opposites" week. While Doppelganger Tesla rode horrible misses on Tuesday to a double-digit rally, Meta Platforms produced impressive beats above Wall Street consensus after the close on Wednesday, only to watch the share price collapse by nearly 10%.

Read more

Forex MAJORS

Cryptocurrencies

Signatures