|

GBP/USD Price Analysis: Bulls approach 1.2435 hurdle amid five-day uptrend

  • GBP/USD picks up bids to refresh intraday high; extends previous two-week winning streak.
  • RSI conditions, six-week-old resistance line challenge Cable buyers.
  • 21-SMA, ascending trend line from early January puts a floor under the price.

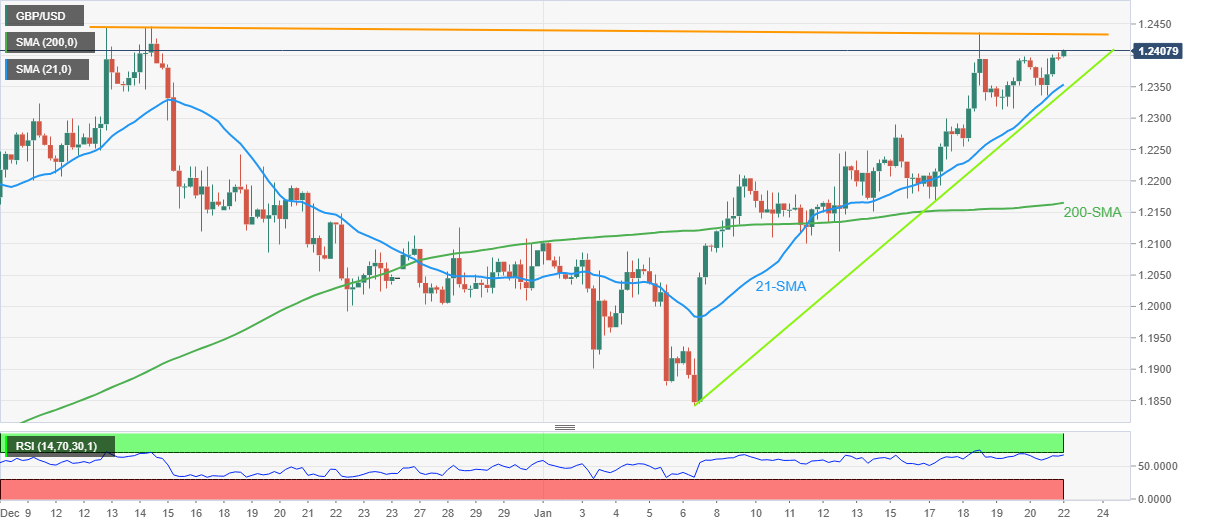
GBP/USD stays on the front foot as bulls keep the driver’s seat during early Monday morning in Asia, after a two-week uptrend. That said, the Cable pair renews its intraday high near 1.2410 while rising for the fifth consecutive day as of late.

In doing so, the quote extends the previous day’s rebound from the 21-SMA, around 1.2350 by the press time.

In addition to the 21-SMA, an upward-sloping support line from January 06, close to 1.2340 at the latest, also restricts the short-term downside of the Cable pair.

Should the quote drops below 1.2340 support, the 200-SMA level surrounding 1.2165 will act as the last defense of the GBP/USD pair buyers, a break of which won’t hesitate to give control to the bears targeting the 1.2000 psychological magnet.

It’s worth noting that the RSI (14) is near the overbought territory, which in turn highlights a 1.5-month-old resistance line near 1.2435 as the key challenge for the GBP/USD bulls.

Following that, the previous monthly high near 1.2450 will be crucial to watch as a clear upside break of the same could propel the quote toward May 2022 high near 1.2670.

In a case where the GBP/USD price remains firmer past 1.2670, the March 2022 low around the 1.3000 round figure will be in focus.

GBP/USD: Four-hour chart
Trend: Limited upside expected

Additional important levels

Overview
Today last price1.2409
Today Daily Change0.0014
Today Daily Change %0.11%
Today daily open1.2395
 
Trends
Daily SMA201.2143
Daily SMA501.211
Daily SMA1001.1724
Daily SMA2001.1978
 
Levels
Previous Daily High1.2404
Previous Daily Low1.2335
Previous Weekly High1.2436
Previous Weekly Low1.2169
Previous Monthly High1.2447
Previous Monthly Low1.1992
Daily Fibonacci 38.2%1.2378
Daily Fibonacci 61.8%1.2362
Daily Pivot Point S11.2352
Daily Pivot Point S21.2309
Daily Pivot Point S31.2283
Daily Pivot Point R11.2421
Daily Pivot Point R21.2447
Daily Pivot Point R31.249

Author

Anil Panchal

Anil Panchal

FXStreet

Anil Panchal has nearly 15 years of experience in tracking financial markets. With a keen interest in macroeconomics, Anil aptly tracks global news/updates and stays well-informed about the global financial moves and their implications.


More from Anil Panchal
Share:

Editor's Picks

GBP/USD bounces off four-day lows, still below 1.3500

GBP/USD sticks to the bearish tone on Thursday, coming down to the 1.3480 region in the latter part of the NA session. In the meantime, Cable’s weakness comes as investors continue to assess mixed UK data, poor US results, and the persistent uncertainty surrounding the US-Iran conflict.

EUR/USD looks apathetic around 1.1530

EUR/USD reverses Wednesday’s downtick and trades with modest gains in the 1.1530 region following the end of the NA session on Thursday. The pair’s tepid advance comes on the back of the absence of clear direction in the US Dollar despite tensions from the Middle East appear far from alleviated. Later on Friday, investors are expected to monitor the the releases of another revision of GDP figures in the Euroland, US Retail Sales and the preliminary U-Mich gauge.

Gold remains on the defensive below $4,350; downside seems cushioned

Gold trades below $4,350 during the Asian session on Friday and looks to extend the previous day's pullback from the highest level since June 5 as the US-Iran standoff continues to underpin the US Dollar's reserve-currency status. However, reduced bets for an immediate Fed rate hike, amid signs of cooling US inflation, should act as a tailwind for the non-yielding bullion and help limit deeper losses.

Dogecoin reclaims $0.07 support as whales step in
Dogecoin (DOGE) edges above the daily open, trading above $0.070 as of Thursday. While this uptick offers a positive signal, DOGE continues to trade within a broader bearish context, down approximately 12% from its July peak of $0.079. Still, should the $0.070 support level hold, the mild recovery could gather pace, targeting resistance at $0.080 and potentially the key $0.100 threshold.
Why credit markets aren’t pricing $570B of AI debt

Forecasts put global artificial intelligence related debt issuance near $570 billion this year, with roughly $236 billion of it priced by the end of May at four times the prior year's pace. Data centre securitisation alone has gone from about $4 billion a year through 2022 to roughly $10 billion in each of 2023 and 2024, and then $27 billion in 2025.

Why is Crude Oil priced for a reopening the ships haven't made?
Fourteen vessels crossed the Strait of Hormuz on Tuesday. Before the war, the count ran near 120 a day. In the sessions since the waterway was publicly declared open, Brent has drifted back to $87 and West Texas Intermediate (WTI) to $81, both a little lower again on Wednesday, with daily momentum on each unwound from the top of its range in late July to the low twenties now.














