GBP/USD Price Analysis: Bears look to seize control below 23.6% Fibo. amid modest USD strength
- GBP/USD meets with some supply on Wednesday amid a modest pickup in the USD demand.
- The mixed technical setup warrants caution for bears and before positioning for further losses.
- A sustained move beyond the 1.2700 mark is needed to support prospects for additional gains.
The GBP/USD pair comes under heavy selling pressure following the previous day's two-way directionless price moves and drops to the 1.2665 region during the Asian session on Wednesday.
Despite Tuesday’s disappointing release of the US Durable Goods Orders, investors seem convinced that the Federal Reserve (Fed) will wait until the June policy meeting before cutting interest rates. This helps revive the US Dollar (USD) demand, which, in turn, is seen as a key factor exerting downward pressure on the GBP/USD pair. The downfall, meanwhile, seems unaffected by the overnight hawkish remarks by the Bank of England (BoE) Deputy Governor Dave Ramsden, saying that he wanted more evidence that inflationary pressures were easing to consider a cut in interest rates.
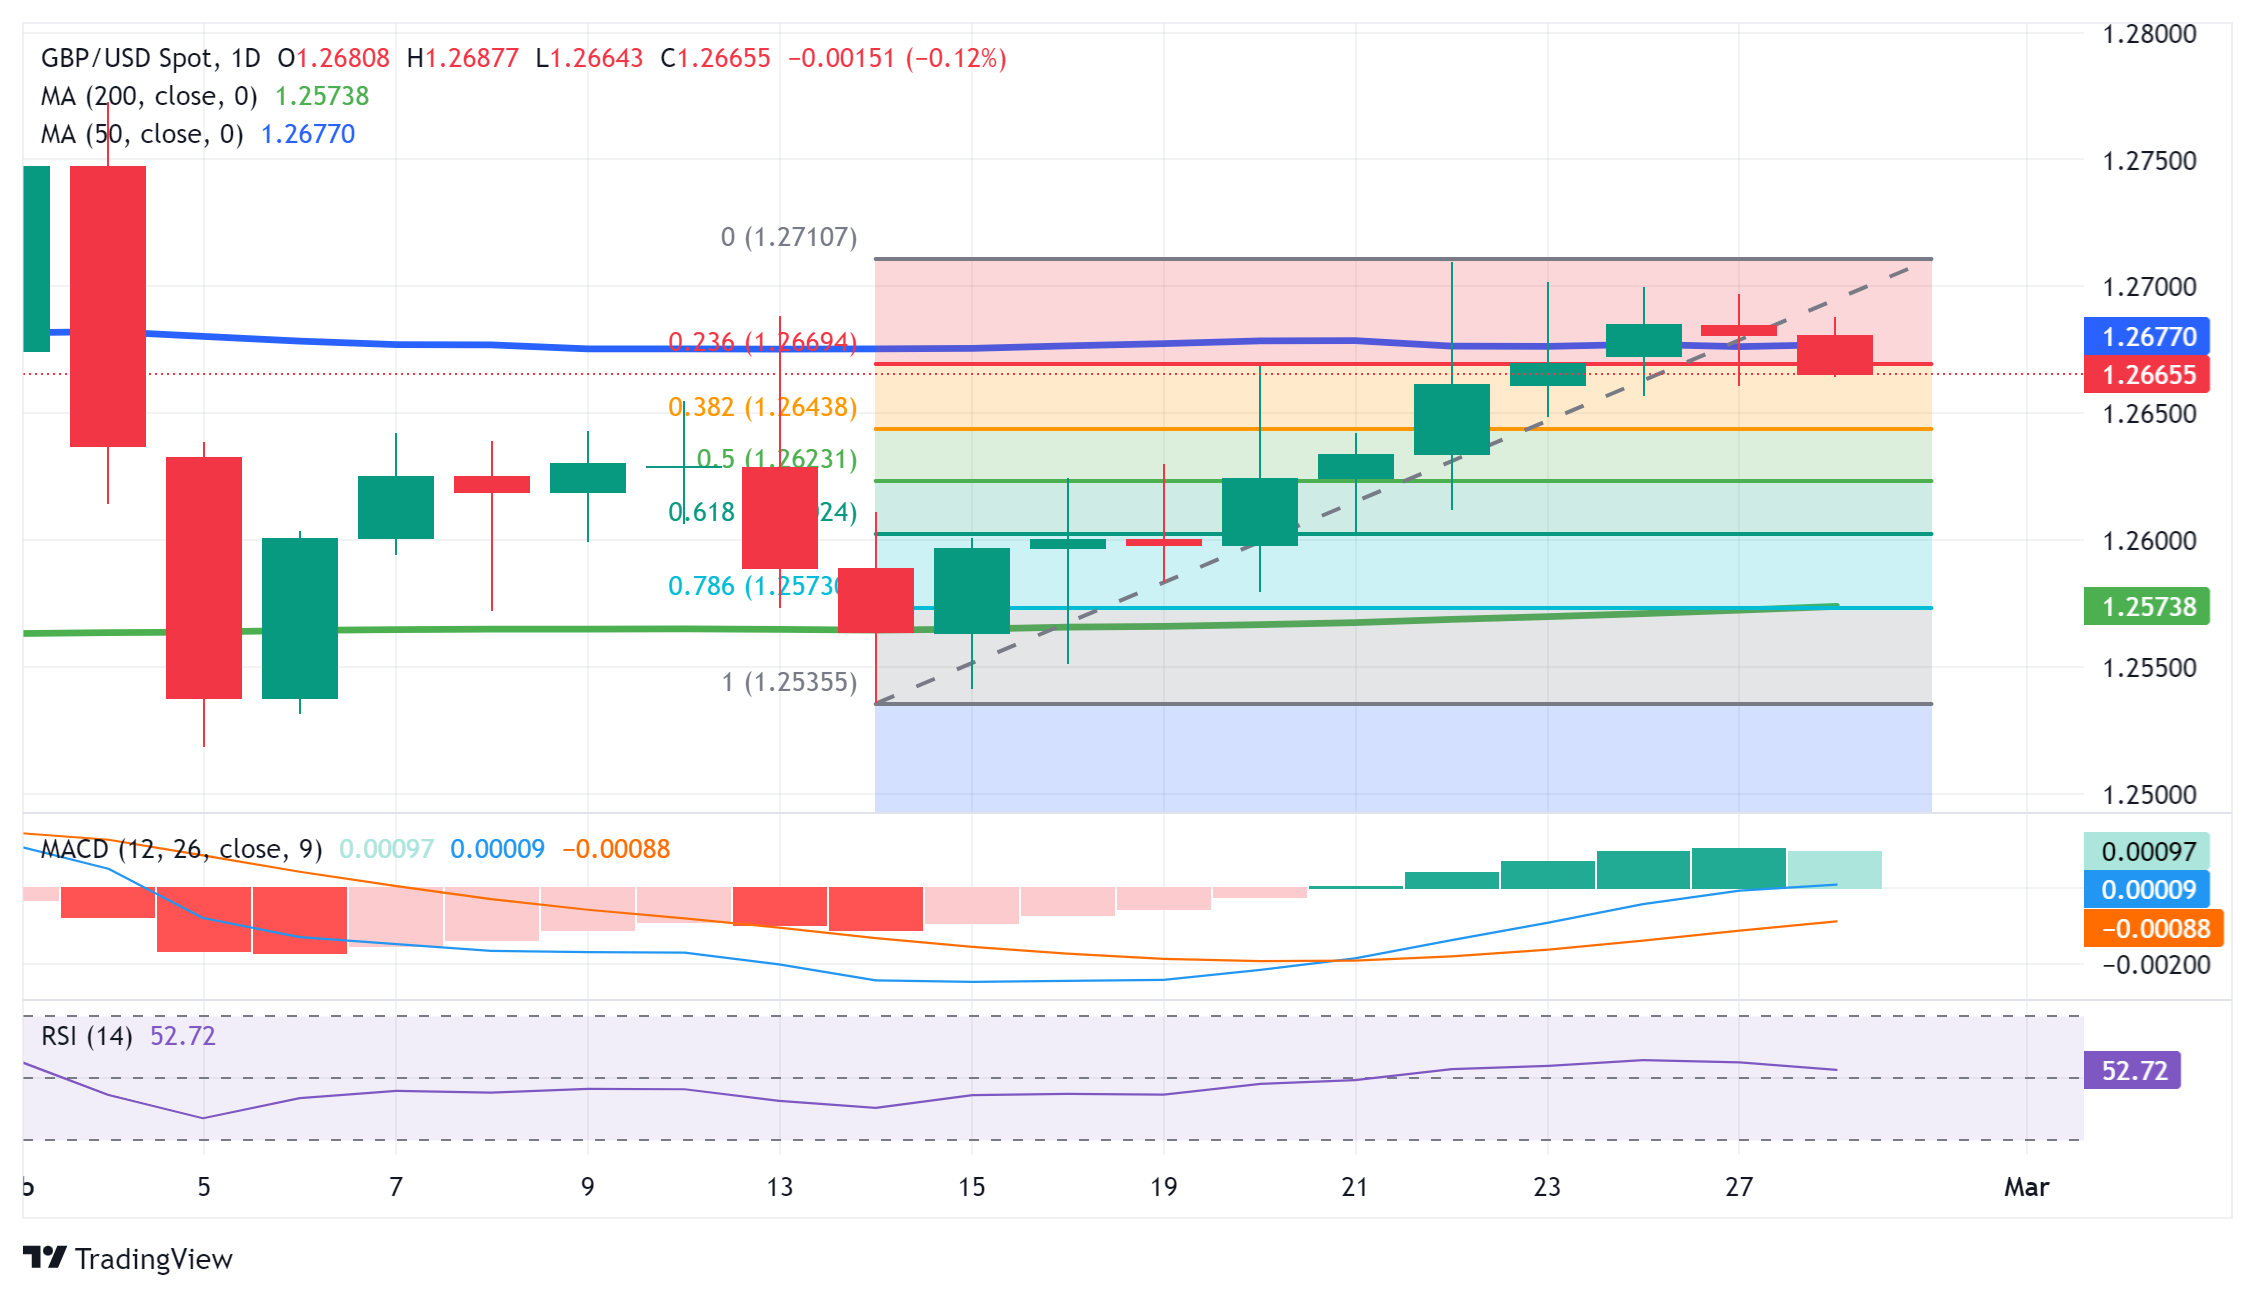
From a technical perspective, the recent repeated failures to find acceptance above the 50-day Simple Moving Average (SMA) and a slide below the 23.6% Fibonacci retracement level of a nearly two-week-old uptrend favours bearish traders. That said, oscillators on the daily chart are holding in the positive territory and warrant some caution. Hence, any subsequent decline is more likely to find decent support near the 1.2645 area, representing 38.2% Fibo. level. A convincing break below, however, will set the stage for a further near-term depreciating move for the GBP/USD pair.
Spot prices might then accelerate the slide towards the 50% Fibo. level, around the 1.2625 region, before dropping to the 1.2600 mark, or the 61.8% Fibo. level, and the 1.2575 confluence. The latter comprises the 78.6% Fibo. level and the very important 200-day SMA, which if broken decisively will be seen as a fresh trigger for bearish traders and prompt aggressive technical selling around the GBP/USD pair.
On the flip side, momentum beyond the 50-day SMA might continue to confront some resistance ahead of the 1.2700 mark. Some follow-through buying beyond last week's swing high, around the 1.2710 area, however, could trigger a short-covering rally and lift the GBP/USD pair back towards the monthly swing high, around the 1.2770 supply zone. A sustained strength beyond the latter has the potential to lift spot prices beyond the 1.2800 mark, towards the December 2023 peak, around the 1.2825-1.2830 region.
GBP/USD daily chart
Author

Haresh Menghani
FXStreet
Haresh Menghani is a detail-oriented professional with 10+ years of extensive experience in analysing the global financial markets.


