GBP/USD oscilates in low volumes around Friday's high but bears are lurking


  • GBP/USD bears could be about to make a move.
  • The multi-time frame structures are dominating the technicals and make for a bias to the downside.

GBP/USD corrected from the low 1.19s on Friday, denting the bear's dominance ahead of a US holiday on Monday as traders squared up into the long weekend. At the time of writing, GBP/USD is trading near 1.2050 and remains in consolidation between the day's low of 1.2014 and 1.2056. 

For some background, the pair has been capped where equal highs were put in near 1.2450 between mid-December and late January whereby the price corrected a strong monthly bearish impulse to a 61.8% Fibonacci of the range: 

GBP/USD monthly chart

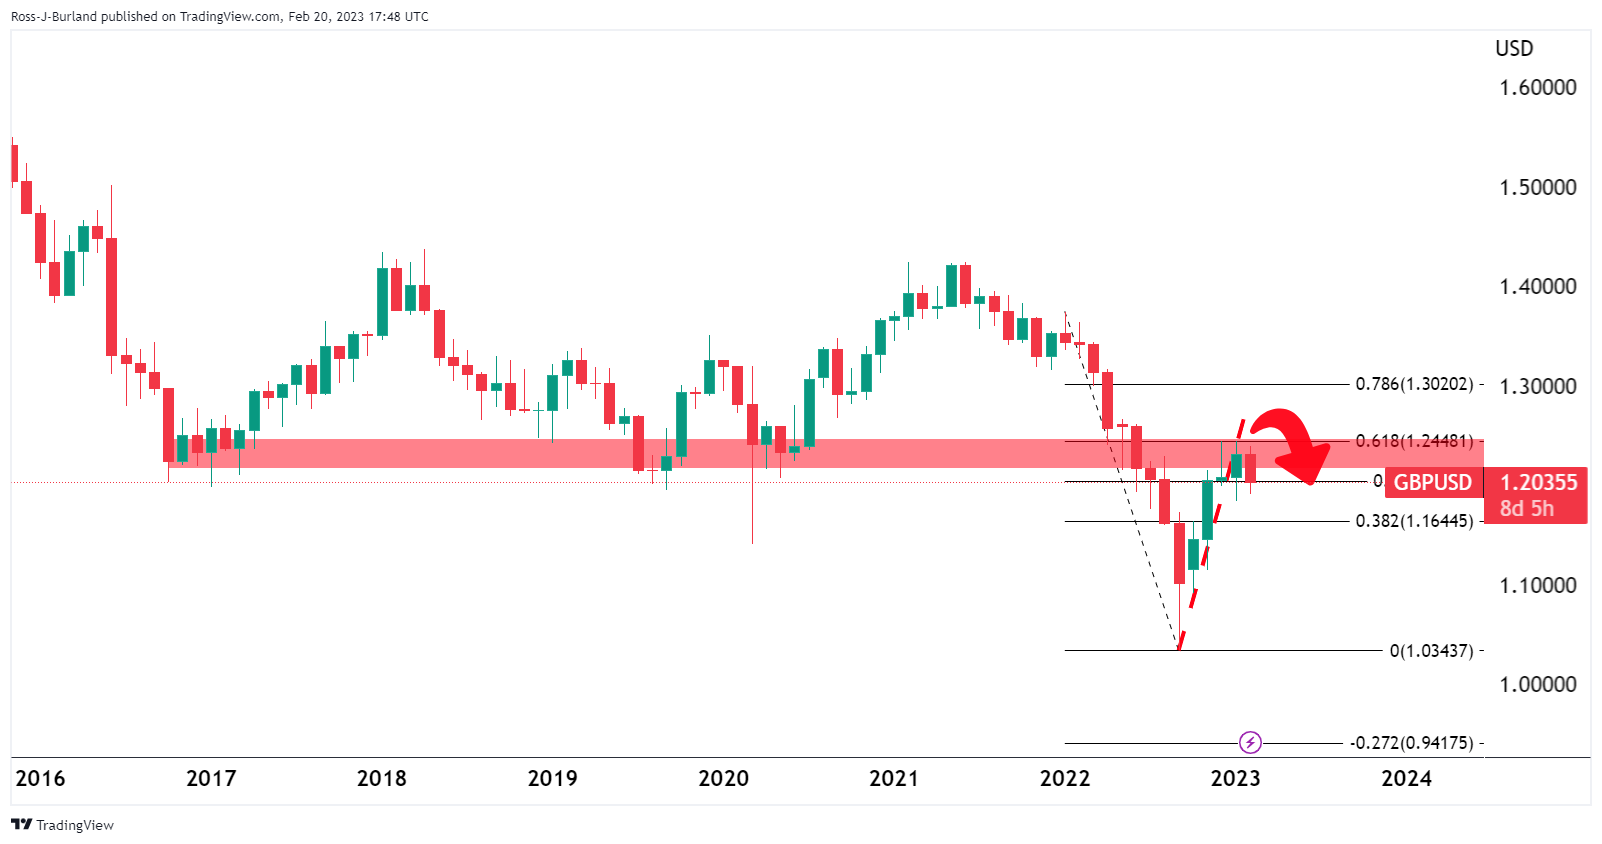
Given the steepness of the correction, while the downside bias is coming to the fore, a gradual decline could be in order and the bears have already made their first move, breaking the old monthly support:

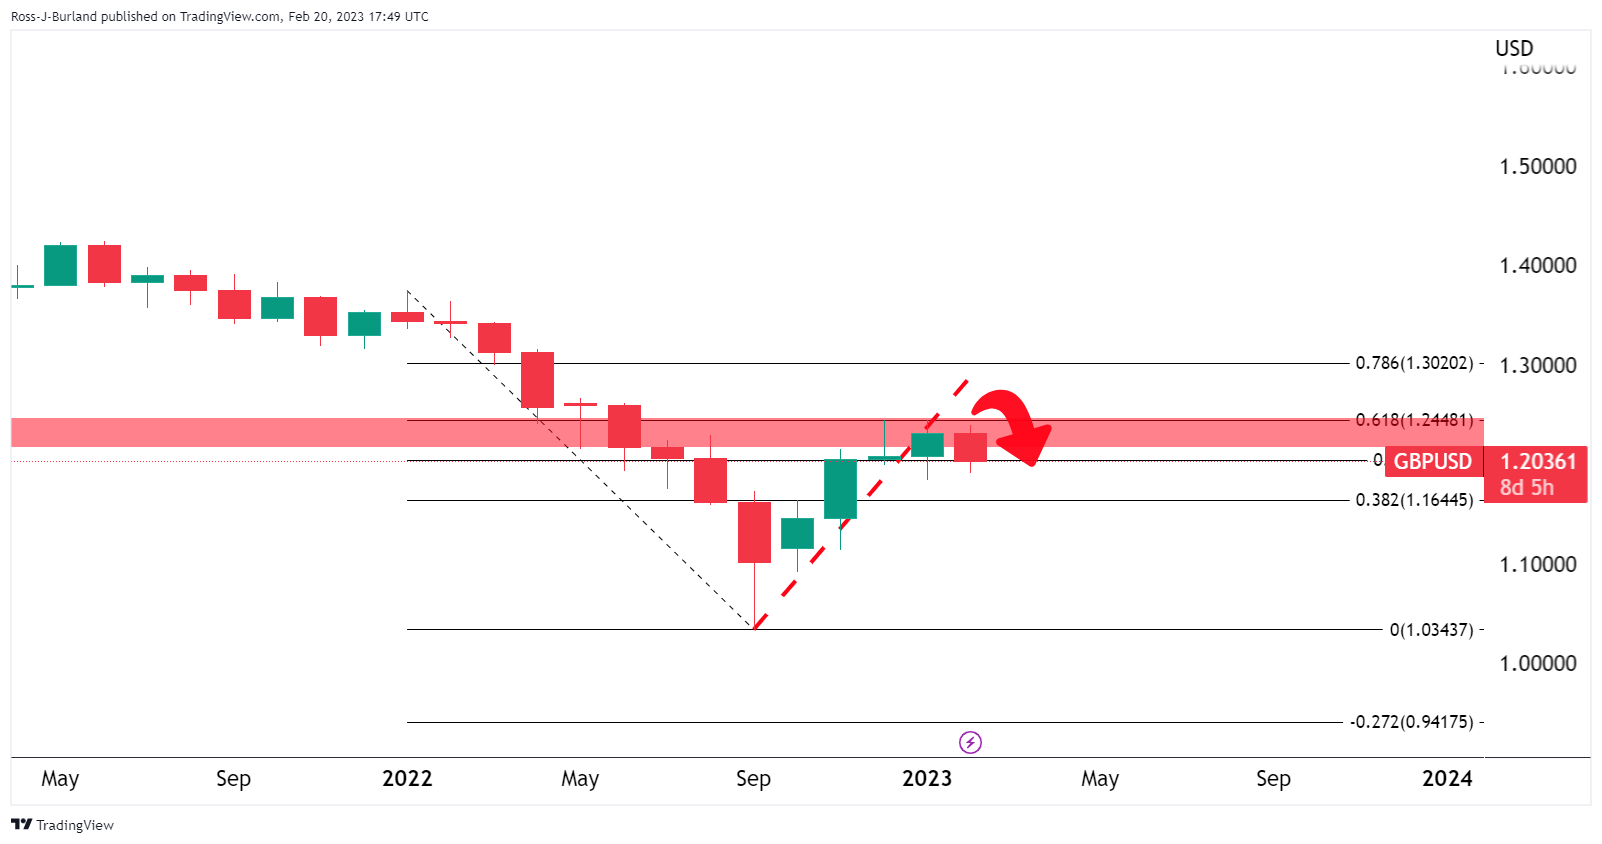
GBP/USD weekly chart

From a weekly perspective, a bearish head and shoulders could be forming:

While on the backside of the prior bullish trend's support line, the bears will be looking for a solid structure to lean against for a move to target the prior resistance in the bullish leg that has the confluence with the 61.8% Fibonacci retracement near 1.1650. 
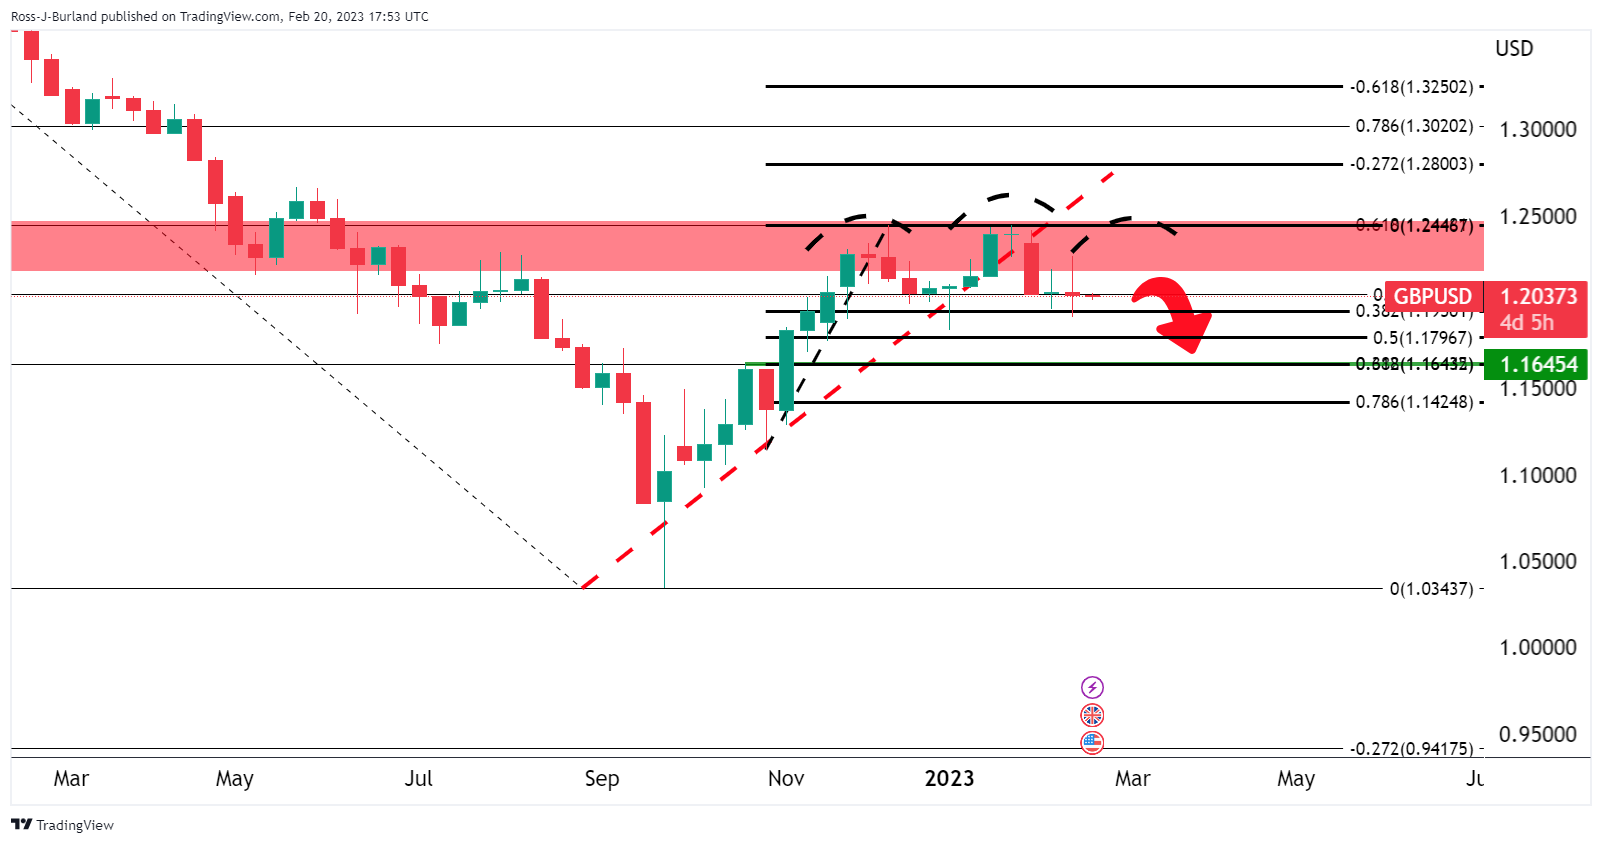
GBP/USD daily chart

For structure, the bears can look to the lower time frames:

While it is too early in the right-hand shoulder's formation phase, a move lower could still be in order for the meantime as the price discovery plays out. 

Currently, within the right-hand shoulder's formation, there is an M-pattern on the daily chart that is formed above where there was a break of structure, BoS, at the start of the year. The price has corrected the bearish leg of the pattern to a 38.2% Fibonacci level near 1.2050 and should this hold as resistance, at the neckline of the pattern, then a downside extension would be in order for a run to test 1.1850 territory for the days ahead. 
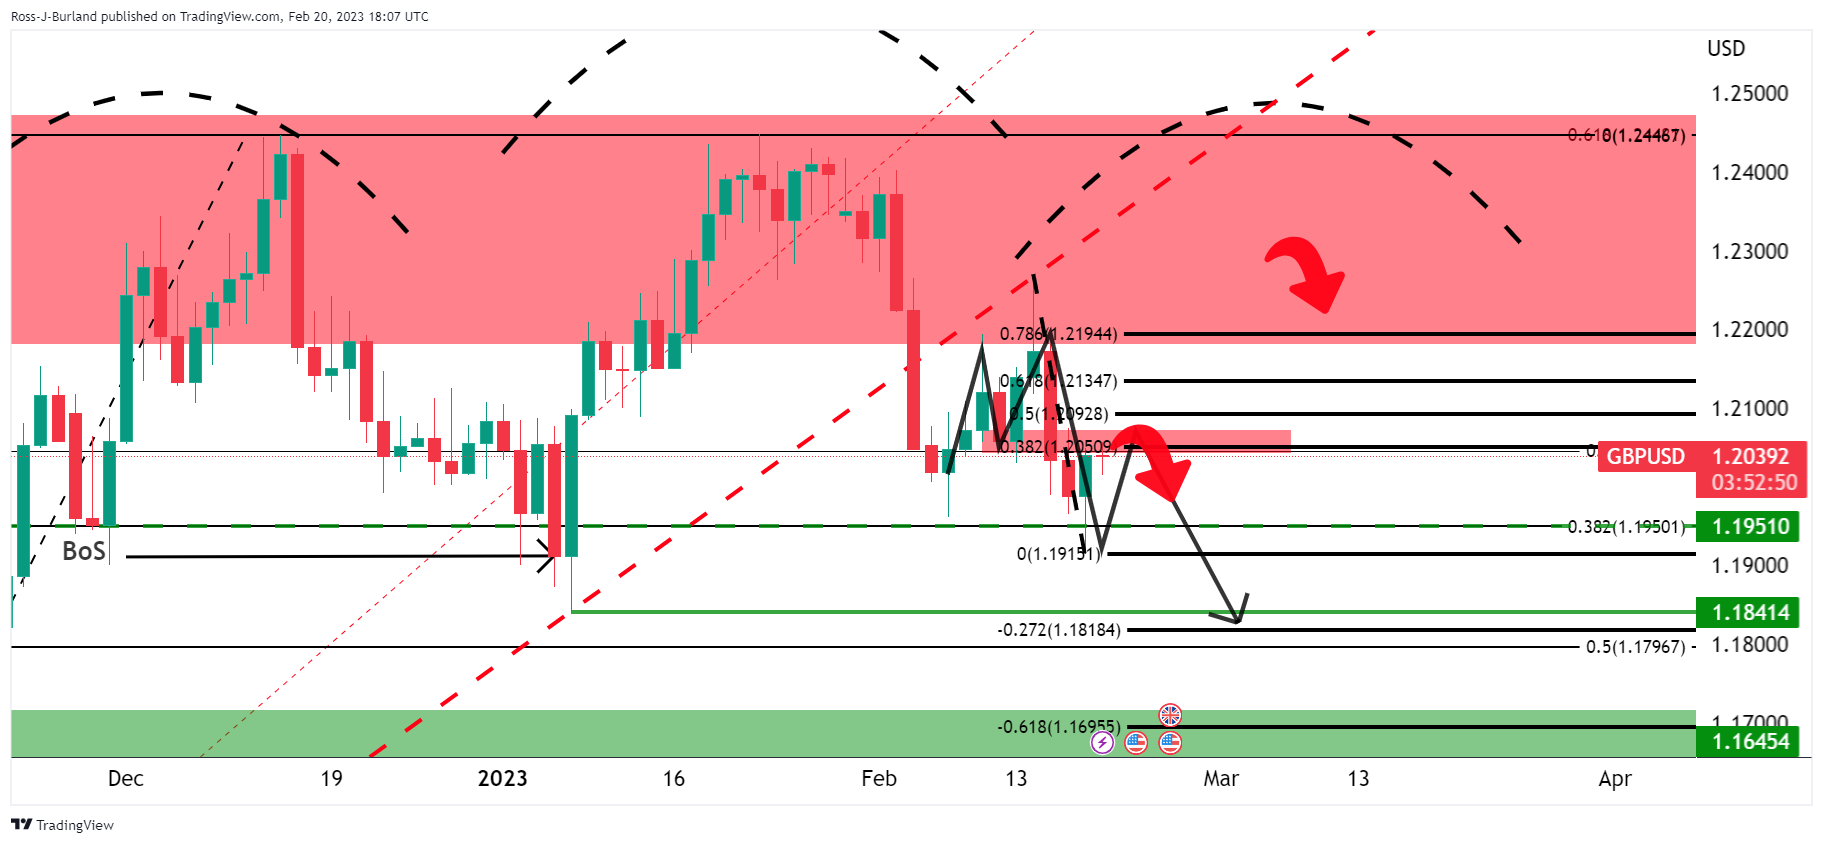
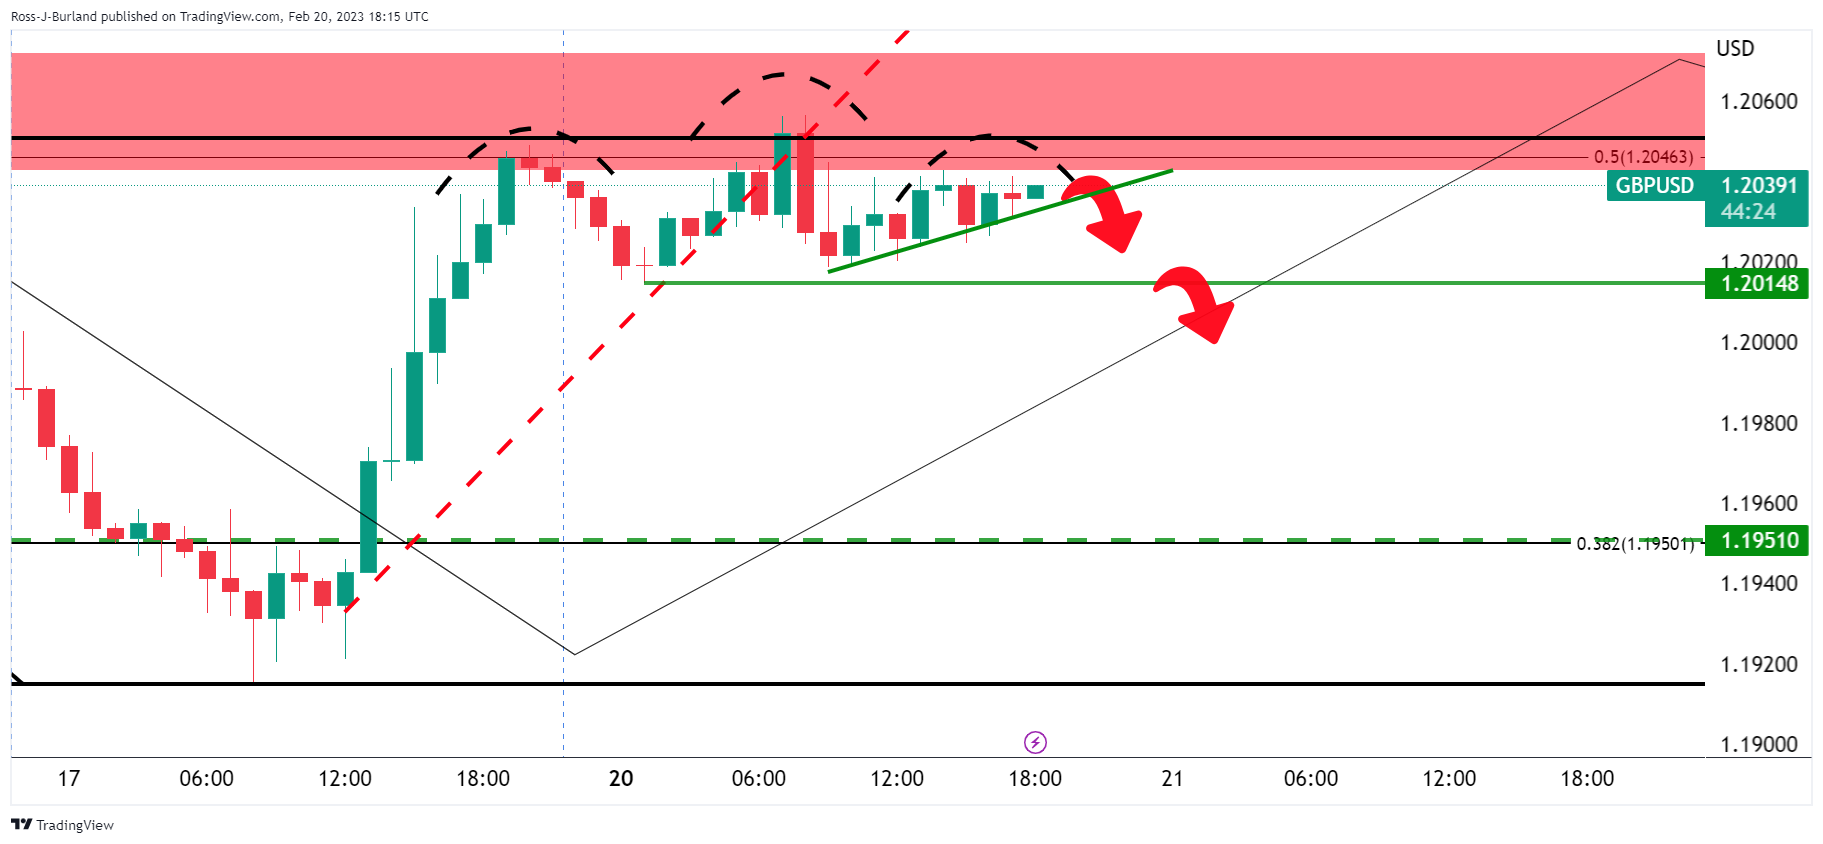
GBP/USD H1 chart

From a 1-hour perspective, the bears could be active on a break of the 1.2015 level and prior support which is a neckline of the current hourly head and shoulders:

Share: Feed news

Information on these pages contains forward-looking statements that involve risks and uncertainties. Markets and instruments profiled on this page are for informational purposes only and should not in any way come across as a recommendation to buy or sell in these assets. You should do your own thorough research before making any investment decisions. FXStreet does not in any way guarantee that this information is free from mistakes, errors, or material misstatements. It also does not guarantee that this information is of a timely nature. Investing in Open Markets involves a great deal of risk, including the loss of all or a portion of your investment, as well as emotional distress. All risks, losses and costs associated with investing, including total loss of principal, are your responsibility. The views and opinions expressed in this article are those of the authors and do not necessarily reflect the official policy or position of FXStreet nor its advertisers. The author will not be held responsible for information that is found at the end of links posted on this page.

If not otherwise explicitly mentioned in the body of the article, at the time of writing, the author has no position in any stock mentioned in this article and no business relationship with any company mentioned. The author has not received compensation for writing this article, other than from FXStreet.

FXStreet and the author do not provide personalized recommendations. The author makes no representations as to the accuracy, completeness, or suitability of this information. FXStreet and the author will not be liable for any errors, omissions or any losses, injuries or damages arising from this information and its display or use. Errors and omissions excepted.

The author and FXStreet are not registered investment advisors and nothing in this article is intended to be investment advice.

Recommended content


Recommended content

Editors’ Picks

AUD/USD regains the constructive outlook above the 200-day SMA

AUD/USD regains the constructive outlook above the 200-day SMA

AUD/USD advanced strongly for the second session in a row, this time extending the recovery to the upper 0.6500s and shifting its focus to the weekly highs in the 0.6580-0.6585 band, an area coincident with the 100-day SMA.

AUD/USD News

EUR/USD keeps the bullish performance above 1.0700

EUR/USD keeps the bullish performance above 1.0700

The continuation of the sell-off in the Greenback in the wake of the FOMC gathering helped EUR/USD extend its bounce off Wednesday’s lows near 1.0650, advancing past the 1.0700 hurdle ahead of the crucial release of US NFP on Friday.

EUR/USD News

Gold stuck around $2,300 as market players lack directional conviction

Gold stuck around $2,300 as market players lack directional conviction

Gold extended its daily slide and dropped below $2,290 in the second half of the day on Thursday. The benchmark 10-year US Treasury bond yield erased its daily losses after US data, causing XAU/USD to stretch lower ahead of Friday's US jobs data.

Gold News

Bitcoin price rises 5% as BlackRock anticipates a new wave of capital inflows into BTC ETFs from investors

Bitcoin price rises 5% as BlackRock anticipates a new wave of capital inflows into BTC ETFs from investors

Bitcoin (BTC) price slid to the depths of $56,552 on Wednesday as the cryptocurrency market tried to front run the Federal Open Market Committee (FOMC) meeting. The flash crash saw millions in positions get liquidated.

Read more

FOMC in the rear-view mirror – NFP eyed

FOMC in the rear-view mirror – NFP eyed

The update from May’s FOMC rate announcement proved more dovish than expected, which naturally weighed on the US dollar (sending the DXY to lows of 105.44) and US yields, as well as, initially at least, underpinning major US equity indices.

Read more

Forex MAJORS

Cryptocurrencies

Signatures