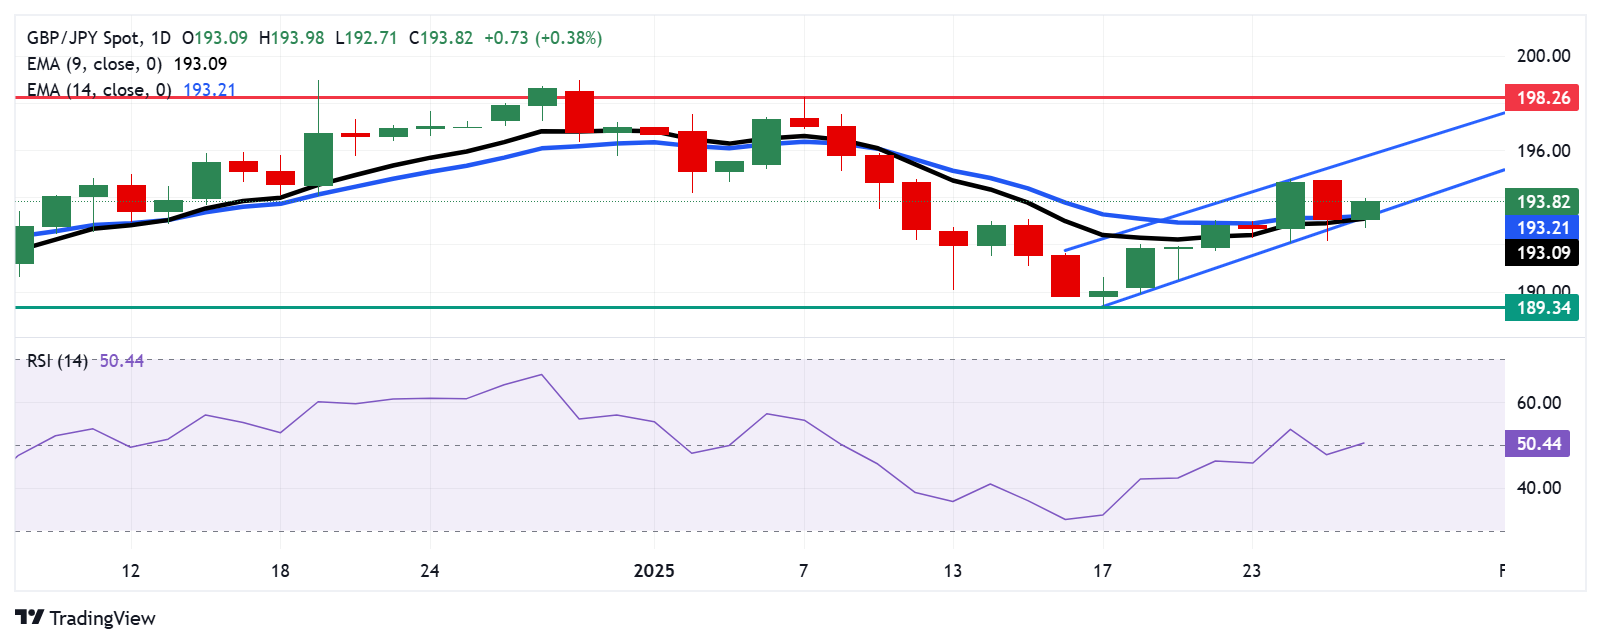
GBP/JPY trades above 193.50 near key support zone within ascending channel
- GBP/JPY could test the crucial support zone around the 14-day EMA at 193.21, followed by the ascending channel's lower boundary.
- The 14-day RSI stays below the 50 level, indicating that bearish momentum is in play.
- The pair may navigate the region around the upper boundary of the ascending channel at the 195.90 level.
GBP/JPY recovers its recent losses registered in the previous session, trading around 193.80 during the European hours on Tuesday. The daily chart analysis shows the currency cross remains close to the lower boundary of its ascending channel pattern, indicating a potential weakening of the bullish bias.
Additionally, the 14-day Relative Strength Index (RSI), a key momentum indicator, remains slightly below the 50 level, signaling that bearish momentum is currently in play. Further movement is expected to provide a clearer directional trend.
However, the GBP/JPY cross grapples to stay above the 14- and nine-day Exponential Moving Averages (EMAs), suggesting that short-term price momentum remains strong. Should the currency cross continue to climb along these EMAs, it would reinforce the bullish bias.
Regarding support levels, the GBP/JPY cross could test the crucial zone around the 14-day EMA at 193.21, followed by the nine-day EMA at 193.09, which aligns with the ascending channel's lower boundary. A break below this crucial zone could strengthen the bearish bias, potentially driving the currency cross toward the eight-week low of 189.34, recorded on January 17.
On the upside, the GBP/JPY cross could retest its primary resistance at the upper boundary of the ascending channel at the 195.90 level. A break above this channel would reinforce the bullish bias and support the currency cross in approaching its January high of 198.26, reached on January 7.
GBP/JPY: Daily Chart
British Pound PRICE Today
The table below shows the percentage change of British Pound (GBP) against listed major currencies today. British Pound was the strongest against the Japanese Yen.
| USD | EUR | GBP | JPY | CAD | AUD | NZD | CHF | |
|---|---|---|---|---|---|---|---|---|
| USD | 0.52% | 0.35% | 0.73% | 0.13% | 0.59% | 0.53% | 0.50% | |
| EUR | -0.52% | -0.17% | 0.21% | -0.39% | 0.06% | 0.00% | -0.02% | |
| GBP | -0.35% | 0.17% | 0.41% | -0.22% | 0.20% | 0.16% | 0.14% | |
| JPY | -0.73% | -0.21% | -0.41% | -0.63% | -0.18% | -0.25% | -0.27% | |
| CAD | -0.13% | 0.39% | 0.22% | 0.63% | 0.46% | 0.39% | 0.37% | |
| AUD | -0.59% | -0.06% | -0.20% | 0.18% | -0.46% | -0.06% | -0.08% | |
| NZD | -0.53% | -0.00% | -0.16% | 0.25% | -0.39% | 0.06% | -0.03% | |
| CHF | -0.50% | 0.02% | -0.14% | 0.27% | -0.37% | 0.08% | 0.03% |
The heat map shows percentage changes of major currencies against each other. The base currency is picked from the left column, while the quote currency is picked from the top row. For example, if you pick the British Pound from the left column and move along the horizontal line to the US Dollar, the percentage change displayed in the box will represent GBP (base)/USD (quote).
Author

Akhtar Faruqui
FXStreet
Akhtar Faruqui is a Forex Analyst based in New Delhi, India. With a keen eye for market trends and a passion for dissecting complex financial dynamics, he is dedicated to delivering accurate and insightful Forex news and analysis.


