|

GBP/JPY Price Prediction: Runaway Gap opens as price leaps higher

  • GBP/JPY opens a Runaway Gap on the chart as it vaults higher. 
  • The gap could be a sign the pair is in a strong uptrend which will probably extend.  

GBP/JPY opens a price gap after the open on Monday as it rallies higher following a breakout move from a Right-Angle Triangle pattern last week.

GBP/JPY 4-hour Chart 

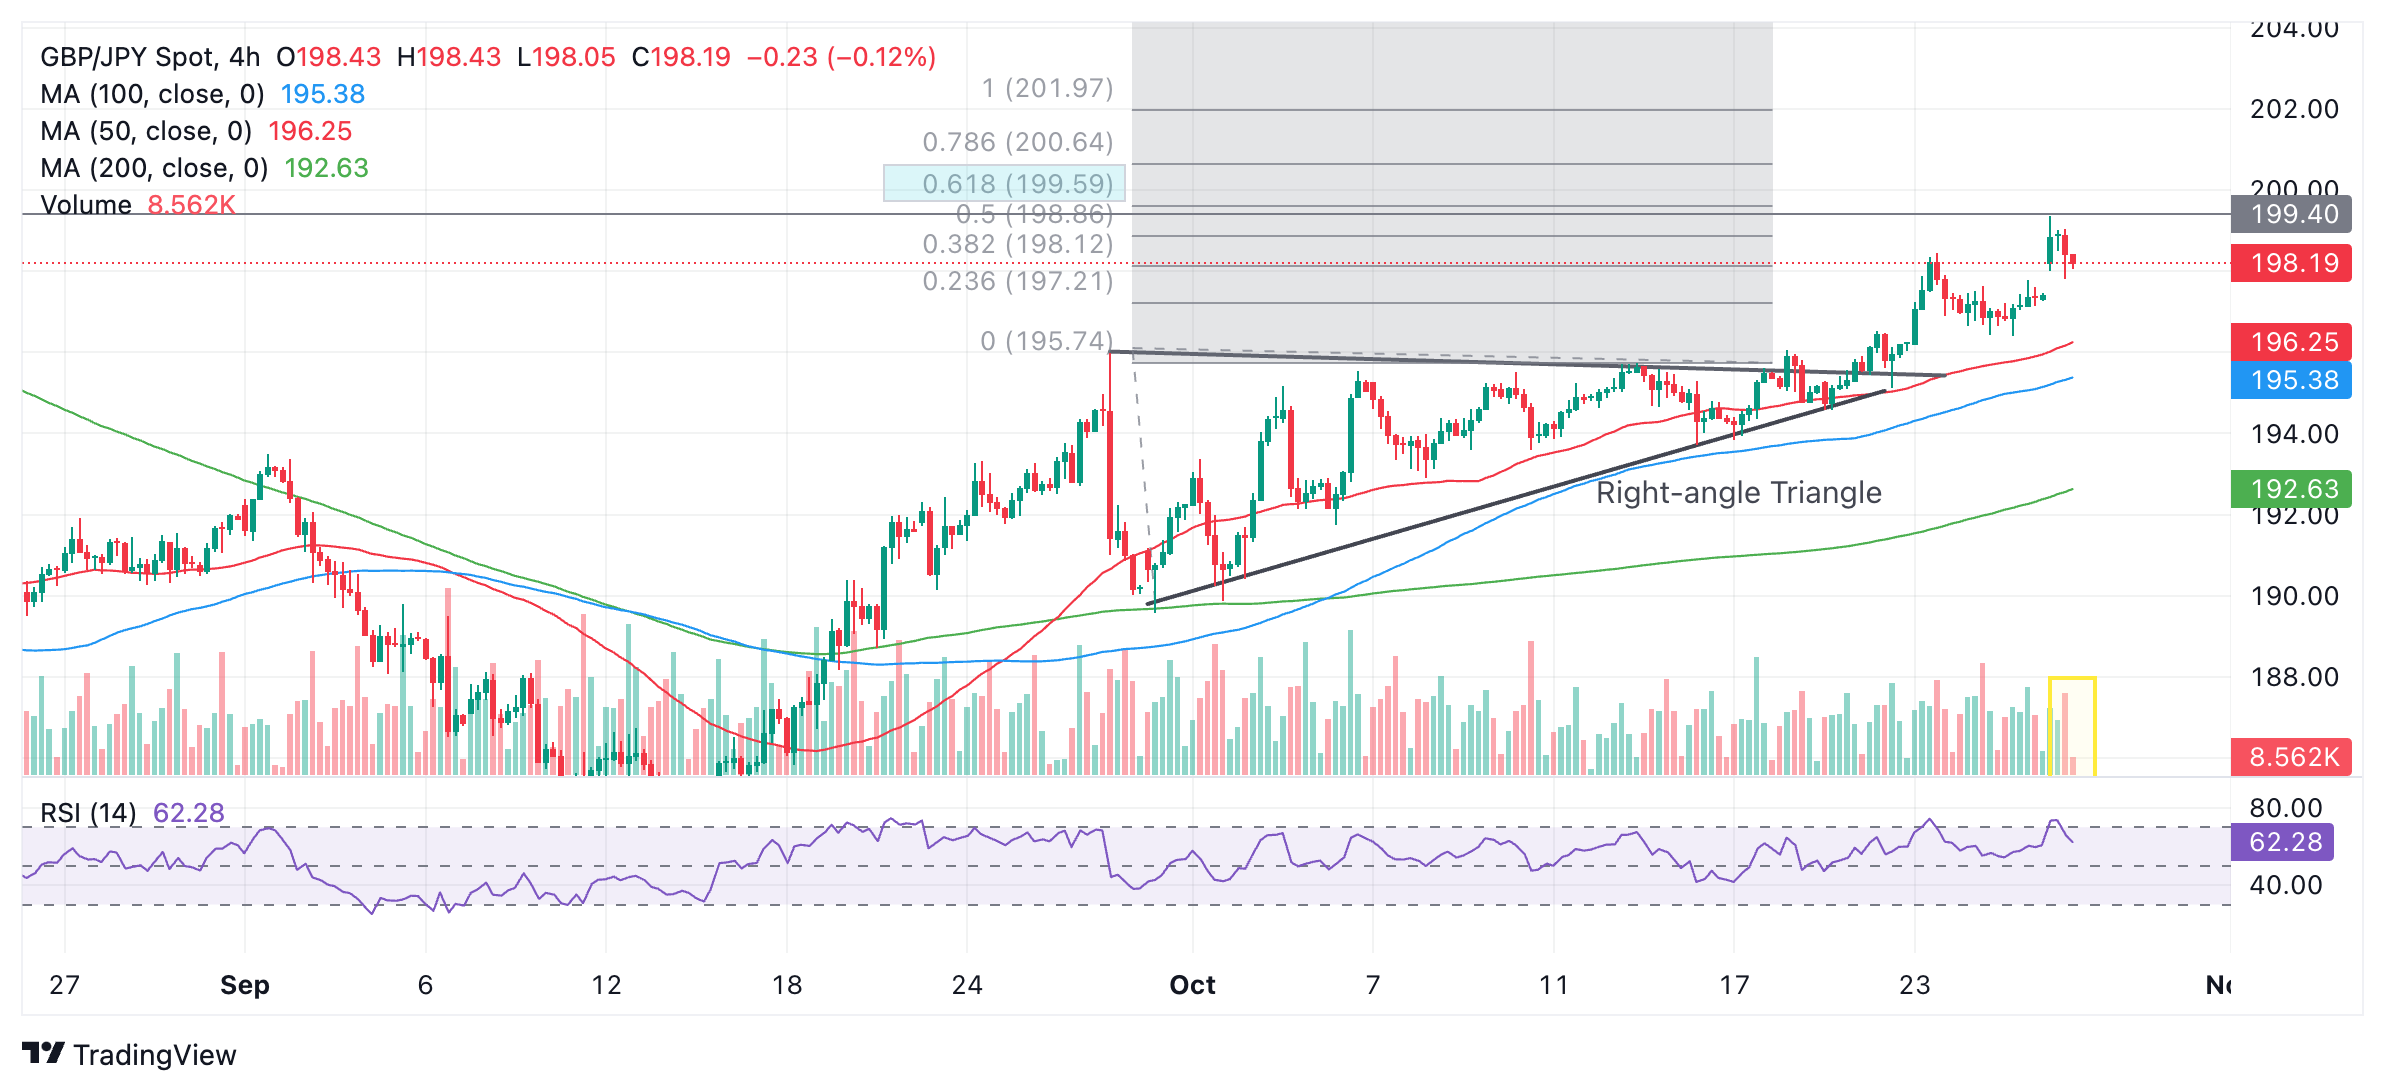
The gap on GBP/JPY is probably what is classed as a “Runaway Gap”. These happen during strong rallies. 

The lack of volume accompanying this gap (yellow rectangle on volume) indicates this is probably not an Exhaustion Gap at the end of the trend. Price is, therefore, likely to continue rising.

Given GBP/JPY is in an established short and medium term uptrend it will probably extend in line with the dictum that “the trend is your friend”.

GBP/JPY has met resistance at the level of the key July 20 lower high at 199.40 and pulled back temporarily. This is just below the first upside target at 199.59 (blue shaded rectangle), the 61.8% Fibonacci extrapolation of the height of the Right Angle Triangle (at its widest point) higher. Price will probably eventually reach 199.59. 

A break above 199.40 would add confirmation of more upside to the target at both 199.59 and 201.97, the 100% extrapolation of the height of the Triangle. 

The Relative Strength Index (RSI) momentum indicator has exited the overbought zone (above 70) suggesting the pair will probably pullback for a while before renewing its uptrend. 

There is a good chance the price will fall and fully close the Runaway Gap before heading higher again. The bottom of the gap could provide a low risk entry point for traders wishing to enter the uptrend at an optimum point. 


Author

Joaquin Monfort

Joaquin Monfort is a financial writer and analyst with over 10 years experience writing about financial markets and alt data. He holds a degree in Anthropology from London University and a Diploma in Technical analysis.

More from Joaquin Monfort
Share:

Editor's Picks

AUD/USD eyes 0.7150 barrier nine-day EMA

AUD/USD inches higher after registering modest losses in the previous day, trading around 0.7130 during the Asian hours. The technical analysis of the daily chart indicates that the pair is moving sideways within the rectangle pattern, suggesting a consolidation as neither the bulls nor the bears have enough momentum to take control of the market.

USD/JPY trades below 160.00 intervention threshold; bullish bias intact

The USD/JPY pair attracts some sellers during the Asian session amid fears that authorities will step in again to prop up the Japanese Yen. Furthermore, the Israel-Lebanon truce prompts some profit-taking around the US Dollar and exerts downward pressure on the currency pair.

Gold meets contention near $4,420…for now

Gold extends its recovery past the $4,500 mark per troy ounce on Thursday. The yellow metal’s advance comes amid the resurgence of some selling interest around the, improving risk sentiment, and declining US Treasury yields across the curve.

Bitcoin’s massive storm is back: Why the sell-off is far from over

Bitcoin price action over the last few weeks has felt less like a normal, healthy correction and more like a slow grinding crash that continues to wreak havoc on holdings and trading accounts. And everything suggests that the dramatic crash isn’t over.

Nonfarm payrolls: Testing the limits of Fed policy patience

The upcoming nonfarm payrolls report for May will provide the final update on the US labor market before Kevin Warsh attends his first policy meeting as the new Fed Chair later this month.

Recession on paper: What really moves the Canadian Loonie now?

Statistics Canada handed the headline writers a gift and the analysts a headache. Real GDP shrank 0.1% on an annualized basis in the first quarter, and with the fourth quarter of 2025 revised down to a 1.0% contraction, that is two negative quarters in a row, the textbook definition of a technical recession and Canada's first since the pandemic.