|

GBP/JPY Price Prediction: Both the short and medium-term trends could now be bearish

  • GBP/JPY has fallen consistently during November, weakening by seven Yen to the Pound.
  • It may now be in a bear trend both in the short and medium term, suggesting the odds favor more downside still. 

GBP/JPY may have reversed both its short and medium-term uptrends after the last bout of weakness. If so, the pair could see more downside on the horizon since it is a principle of technical analysis that the odds favor extensions of trends.


GBP/JPY Daily Chart 

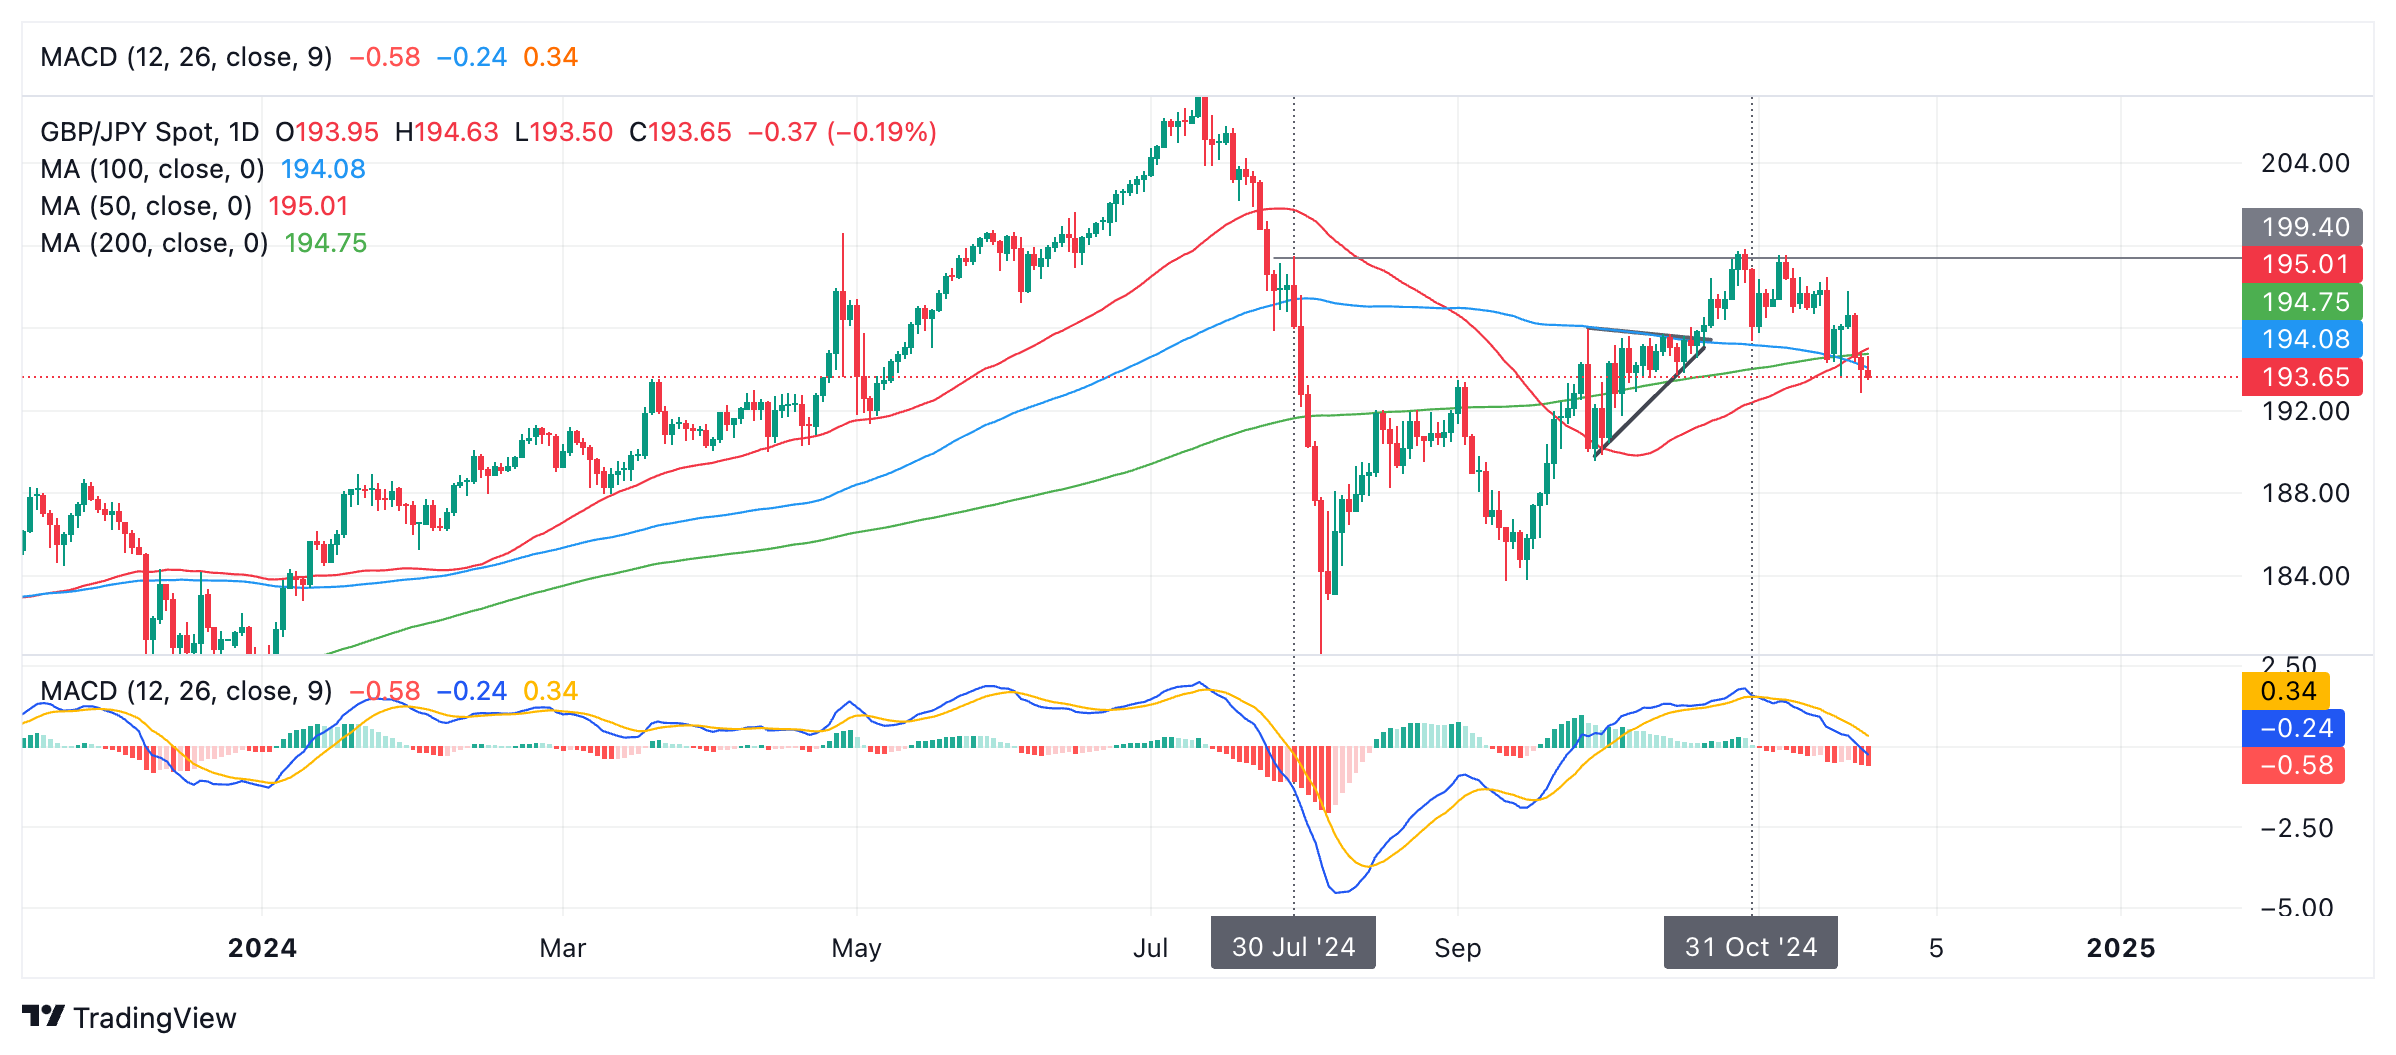
GBP/JPY began selling off on October 31 after it peaked at 199.81 on the preceding day. Since then it has staircased down, reaching a new low in the 192.80s on November 22 – seven whole Japanese Yen (JPY) to the Pound Sterling (GBP) lower than at the end of October.

It has also broken below all three major Simple Moving Averages (SMA), the 50, 100 and 200-day SMAs on a closing basis. 

The (blue) Moving Average Convergence Divergence (MACD) momentum indicator line has both crossed below the red signal line and below the zero level, and taken together these are  bearish signs.  

A break below the 192.80 level could open the way to further losses with the next target at around 189.56, the low of the Right-Angled triangle that formed in late September and early October. 

Author

Joaquin Monfort

Joaquin Monfort is a financial writer and analyst with over 10 years experience writing about financial markets and alt data. He holds a degree in Anthropology from London University and a Diploma in Technical analysis.

More from Joaquin Monfort
Share:

Editor's Picks

EUR/USD deflates to fresh lows, targets 1.1600

The selling pressure on EUR/USD now gathers extra pace, prompting the pair to hit fresh multi-week lows in the 1.1625-1.1620 band on Friday. The continuation of the downward bias comes in response to further gains in the US Dollar as market participants continue to assess the mixed release of US Nonfarm Payrolls in December.

GBP/USD breaks below 1.3400, challenges the 200-day SMA

GBP/USD remains under heavy fire and retreats for the fourth consecutive day on Friday. Indeed, Cable suffers the strong performance of the Greenback, intensified post-mixed NFP, and trades at shouting distance from its critical 200-day SMA near 1.3380.

Gold flirts with yearly tops around $4,500

Gold keeps its positive bias on Friday, adding to Thursday’s advance and challenging yearly highs in the $4,500 region per troy ounce. The risk-off sentiment favours the yellow metal despite the firmer tone in the Greenback and rising US Treasury yields.

Crypto Today: Bitcoin, Ethereum, XRP risk further decline as market fear persists amid slowing demand

Bitcoin holds $90,000 but stays below the 50-day EMA as institutional demand wanes. Ethereum steadies above $3,000 but remains structurally weak due to ETF outflows. XRP ETFs resume inflows, but the price struggles to gain ground above key support.

Week ahead – US CPI might challenge the geopolitics-boosted Dollar

Geopolitics may try to steal the limelight from US data. A possible US Supreme Court ruling on tariffs could dictate market movements. A crammed data calendar next week, US CPI comes on Tuesday; Fedspeak to intensify.

XRP trades under pressure amid weak retail demand

XRP presses down on the 50-day EMA support as risk-averse sentiment spreads despite a positive start to 2026. XRP faces declining retail demand, as reflected in futures Open Interest, which has fallen to $4.15 billion.