|

GBP/JPY Price Analysis: Bears jump back from 160.80 resistance confluence

  • GBP/JPY drops the most in a week while reversing from the key hurdle.
  • Convergence of 21-DMA, fortnight-long descending trend line guards immediate upside.
  • 61.8% Fibonacci retracement level lures bears, 164.30 appears strong resistance.

GBP/JPY stands on the slippery ground as it renews its intraday low near 159.90 during early Thursday morning in London. In doing so, the cross-currency pair prints the first daily loss in five while declining the most in a week.

That said, the pair buyers’ inability to cross the 21-DMA and a two-week-old descending trend line, around 160.80, triggered the quote’s U-turn.

Also adding strength to the downside bias is the looming bear cross between the 50-DMA and the 100-DMA and the former pierces off the latter from above.

With this, the GBP/JPY price is declining towards the last Thursday’s swing low, around 158.50, before directing the bears to the 61.8% Fibonacci retracement level of the September-October upside of the pair, near 157.70.

In a case where the quote remains bearish past 157.70, a downwards-loping support line from December 20, near 153.25, will be important to watch.

On the flip side, the 50% Fibonacci retracement near 160.50 could act as immediate resistance before the 160.80 key hurdle mentioned previously.

It’s worth noting, however, that the GBP/JPY bulls remain off guard unless the quote stays below the 164.30 resistance confluence, encompassing the 50-DMA and 100-DMA.

Overall, GBP/JPY is likely to decline further even if it manages to cross the nearby resistance.

GBP/JPY: Daily chart
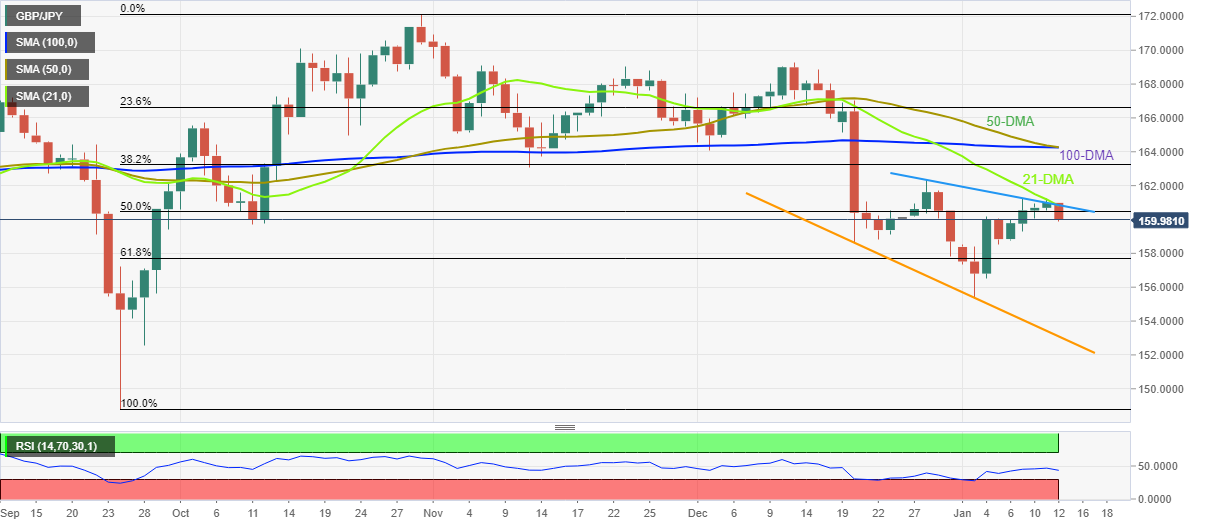
Trend: Bearish

Additional important levels

Overview
Today last price159.99
Today Daily Change-0.99
Today Daily Change %-0.61%
Today daily open160.98
 
Trends
Daily SMA20160.84
Daily SMA50164.37
Daily SMA100164.27
Daily SMA200163.7
 
Levels
Previous Daily High161.22
Previous Daily Low160.51
Previous Weekly High160.18
Previous Weekly Low155.36
Previous Monthly High169.28
Previous Monthly Low157.84
Daily Fibonacci 38.2%160.95
Daily Fibonacci 61.8%160.78
Daily Pivot Point S1160.59
Daily Pivot Point S2160.2
Daily Pivot Point S3159.88
Daily Pivot Point R1161.3
Daily Pivot Point R2161.61
Daily Pivot Point R3162

Author

Anil Panchal

Anil Panchal

FXStreet

Anil Panchal has nearly 15 years of experience in tracking financial markets. With a keen interest in macroeconomics, Anil aptly tracks global news/updates and stays well-informed about the global financial moves and their implications.

More from Anil Panchal
Share:

Markets move fast. We move first.

Orange Juice Newsletter brings you expert driven insights - not headlines. Every day on your inbox.

By subscribing you agree to our Terms and conditions.

Editor's Picks

EUR/USD gathers recovery momentum, trades near 1.1750

Following the correction seen in the second half of the previous week, EUR/USD gathers bullish momentum and trades in positive territory near 1.1750. The US Dollar (USD) struggles to attract buyers and supports the pair as investors await Tuesday's GDP data ahead of the Christmas holiday. 

GBP/USD rises toward 1.3450 on renewed USD weakness

GBP/USD turns north on Monday and avances to the 1.3450 region. The US Dollar (USD) stays on the back foot to begin the new week as investors adjust their positions before tomorrow's third-quarter growth data, helping the pair stretch higher.

Gold extends rally to new record-high above $4,420

Gold extends its rally in the American session on Monday and trades at a new all-time-high above $4,420, gaining nearly 2% on a daily basis. The potential for a re-escalation of the tensions in the Middle East on news of Israel planning to attack Iran allows Gold to capitalize on safe-haven flows.

Top 10 crypto predictions for 2026: Institutional demand and big banks could lift Bitcoin

Bitcoin could hit record highs in 2026, according to Grayscale and top crypto asset managers. Institutional demand and digital-asset treasury companies set to catalyze gains in Bitcoin.

Ten questions that matter going into 2026

2026 may be less about a neat “base case” and more about a regime shift—the market can reprice what matters most (growth, inflation, fiscal, geopolitics, concentration). The biggest trap is false comfort: the same trades can look defensive… right up until they become crowded.

Hyperliquid price forecast: Bullish interest builds amid user recovery

Hyperliquid (HYPE) trades at $25 at press time on Monday, holding the 3% gains from the previous day. The perpetual exchange sees a recovery in active users, while weekly fees collected decline to the lowest level so far this month.