|

GBP/JPY Price Analysis: 140.85/80 questions the breakdown of 100-day SMA

  • GBP/JPY struggles around near-term horizontal support.
  • Buyers will look for entry beyond 100-day SMA.
  • A downside break can take aim at 50% Fibonacci retracement.

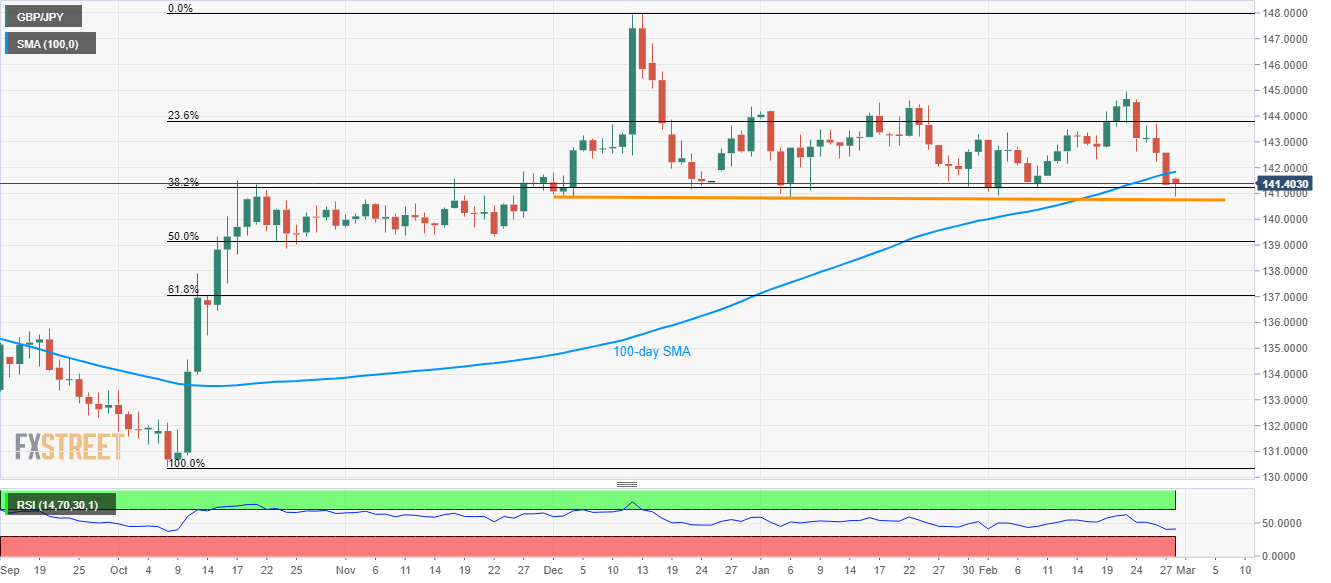
GBP/JPY pulls back from seven-week low while trading around 140.30 during Friday’s Asian session. Even so, the pair nears the key horizontal support established since early December 2019 after the quote slipped below 100-day SMA the previous day.

Hence, sellers will look for entry below 140.85/80 support while targeting 50% Fibonacci retracement of October-December 2019 upside, near 139.20.

However, pair’s further declines could be questioned around 138.70, if not then 61.8% of Fibonacci retracement close to 137.10 will be on the bears’ radars.

On the upside, buyers will refrain from entering unless GBP/JPY prices bounce back beyond a 100-day SMA level of 141.85.

In doing so, 142.60, 143.40 and 23.6% Fibonacci retracement level of 143.83 can offer intermediate halts during the recovery challenging the monthly high close to 145.00.

GBP/JPY daily chart

Trend: Pullback expected

Additional important levels

Overview
Today last price141.28
Today Daily Change-1.29
Today Daily Change %-0.90%
Today daily open142.57
 
Trends
Daily SMA20142.82
Daily SMA50142.8
Daily SMA100141.78
Daily SMA200137.7
 
Levels
Previous Daily High143.72
Previous Daily Low142.24
Previous Weekly High144.96
Previous Weekly Low142.32
Previous Monthly High144.61
Previous Monthly Low140.83
Daily Fibonacci 38.2%142.8
Daily Fibonacci 61.8%143.16
Daily Pivot Point S1141.97
Daily Pivot Point S2141.36
Daily Pivot Point S3140.48
Daily Pivot Point R1143.45
Daily Pivot Point R2144.33
Daily Pivot Point R3144.94

Author

Anil Panchal

Anil Panchal

FXStreet

Anil Panchal has nearly 15 years of experience in tracking financial markets. With a keen interest in macroeconomics, Anil aptly tracks global news/updates and stays well-informed about the global financial moves and their implications.

More from Anil Panchal
Share:

Editor's Picks

EUR/USD looks to regain the 200-day SMA

EUR/USD regains some balance and trade just above 1.1600 the figure ahead of the opening bell in Asia. The pair initially dipped to the 1.1530 zone for the first time since November, always following the stronger US Dollar and the marked flight-to-safety in the context of the ongoing Middle East crisis
 

GBP/USD attacks 1.3300, refreshing three-month lows

GBP/USD is deep in the red near 1.3300, accelerating its downside to renew three-month lows in European trading on Tuesday. The ongoing escalation in the Iran war, combined with rising Oil prices, weighs negatively on the higher-yielding Pound Sterling as the US Dollar capitalizes on increased haven demand.

Gold bounces off lows, back above $5,100

Gold remains on the defensive, eroding part of the recent multi-day advance and managing to trade back above the $5,100 mark per troy ounce on Tuesday. The precious metal initially dropped just below the critical $5,000 threshold on the back of the persistent strength of the Greenback, higher US Treasury yields across the curve and investors' repricing of Fed rate cuts.

XRP risks extending losses as US-Iran war rages on

Ripple (XRP) has come under pressure, drifting lower to $1.35 at the time of writing on Tuesday. The over 2% correction looks poised to erase the previous day’s gains, which lifted the remittance token to $1.42.

Energy shock 2.0: Why rising Gas prices could hit the Euro

Even without a confirmed, sustained disruption, the mere risk to a key global energy chokepoint is enough to inject a significant premium into European Gas markets. And for the Euro, that matters.

Ripple falters amid sell-off jitters and negative funding rates

Ripple (XRP) has come under pressure, drifting lower to $1.35 at the time of writing on Tuesday. The over 2% correction looks poised to erase the previous day’s gains, which lifted the remittance token to $1.42.