GBP/JPY climbs beyond mid-196.00s, hits fresh weekly top ahead of UK CPI
- GBP/JPY recovers further from over a one-month low set on Tuesday amid renewed JPY selling.
- Receding safe-haven demand, along with the BoJ uncertainty, undermines the safe-haven JPY.
- The technical setup warrants caution for bulls ahead of the crucial UK consumer inflation data.

The GBP/JPY cross is seen building on the previous day's strong rebound from the 193.60-193.55 area, or its lowest level since October 8 and gaining positive traction for the third consecutive day on Wednesday. The momentum lifts spot prices beyond the mid-196.00s during the Asian session and is sponsored by the emergence of fresh selling around the Japanese Yen (JPY).
Comments from Russian and US officials helped ease market concerns about the onset of a full-blown nuclear war. This, along with the uncertainty over the timing of further monetary policy tightening by the Bank of Japan (BoJ), undermines the safe-haven JPY. Meanwhile, hopes that the UK government’s fiscal stimulus to bolster domestic demand will lead to inflationary pressures and delay the Bank of England's (BoE) rate-cutting cycle offer some support to the British Pound (GBP). This further seems to act as a tailwind for the GBP/JPY cross.
That said, speculations that Japanese authorities might intervene in the FX market to prop up the domestic currency, coupled with geopolitical uncertainties, might hold back the JPY bears from placing aggressive bets. Investors might also refrain from placing aggressive directional bets around the GBP/JPY cross and opt to wait for the release of the latest UK consumer inflation figures. The crucial data will play a key role in influencing the broader sentiment surrounding the GBP and provide some meaningful impetus to the currency pair.
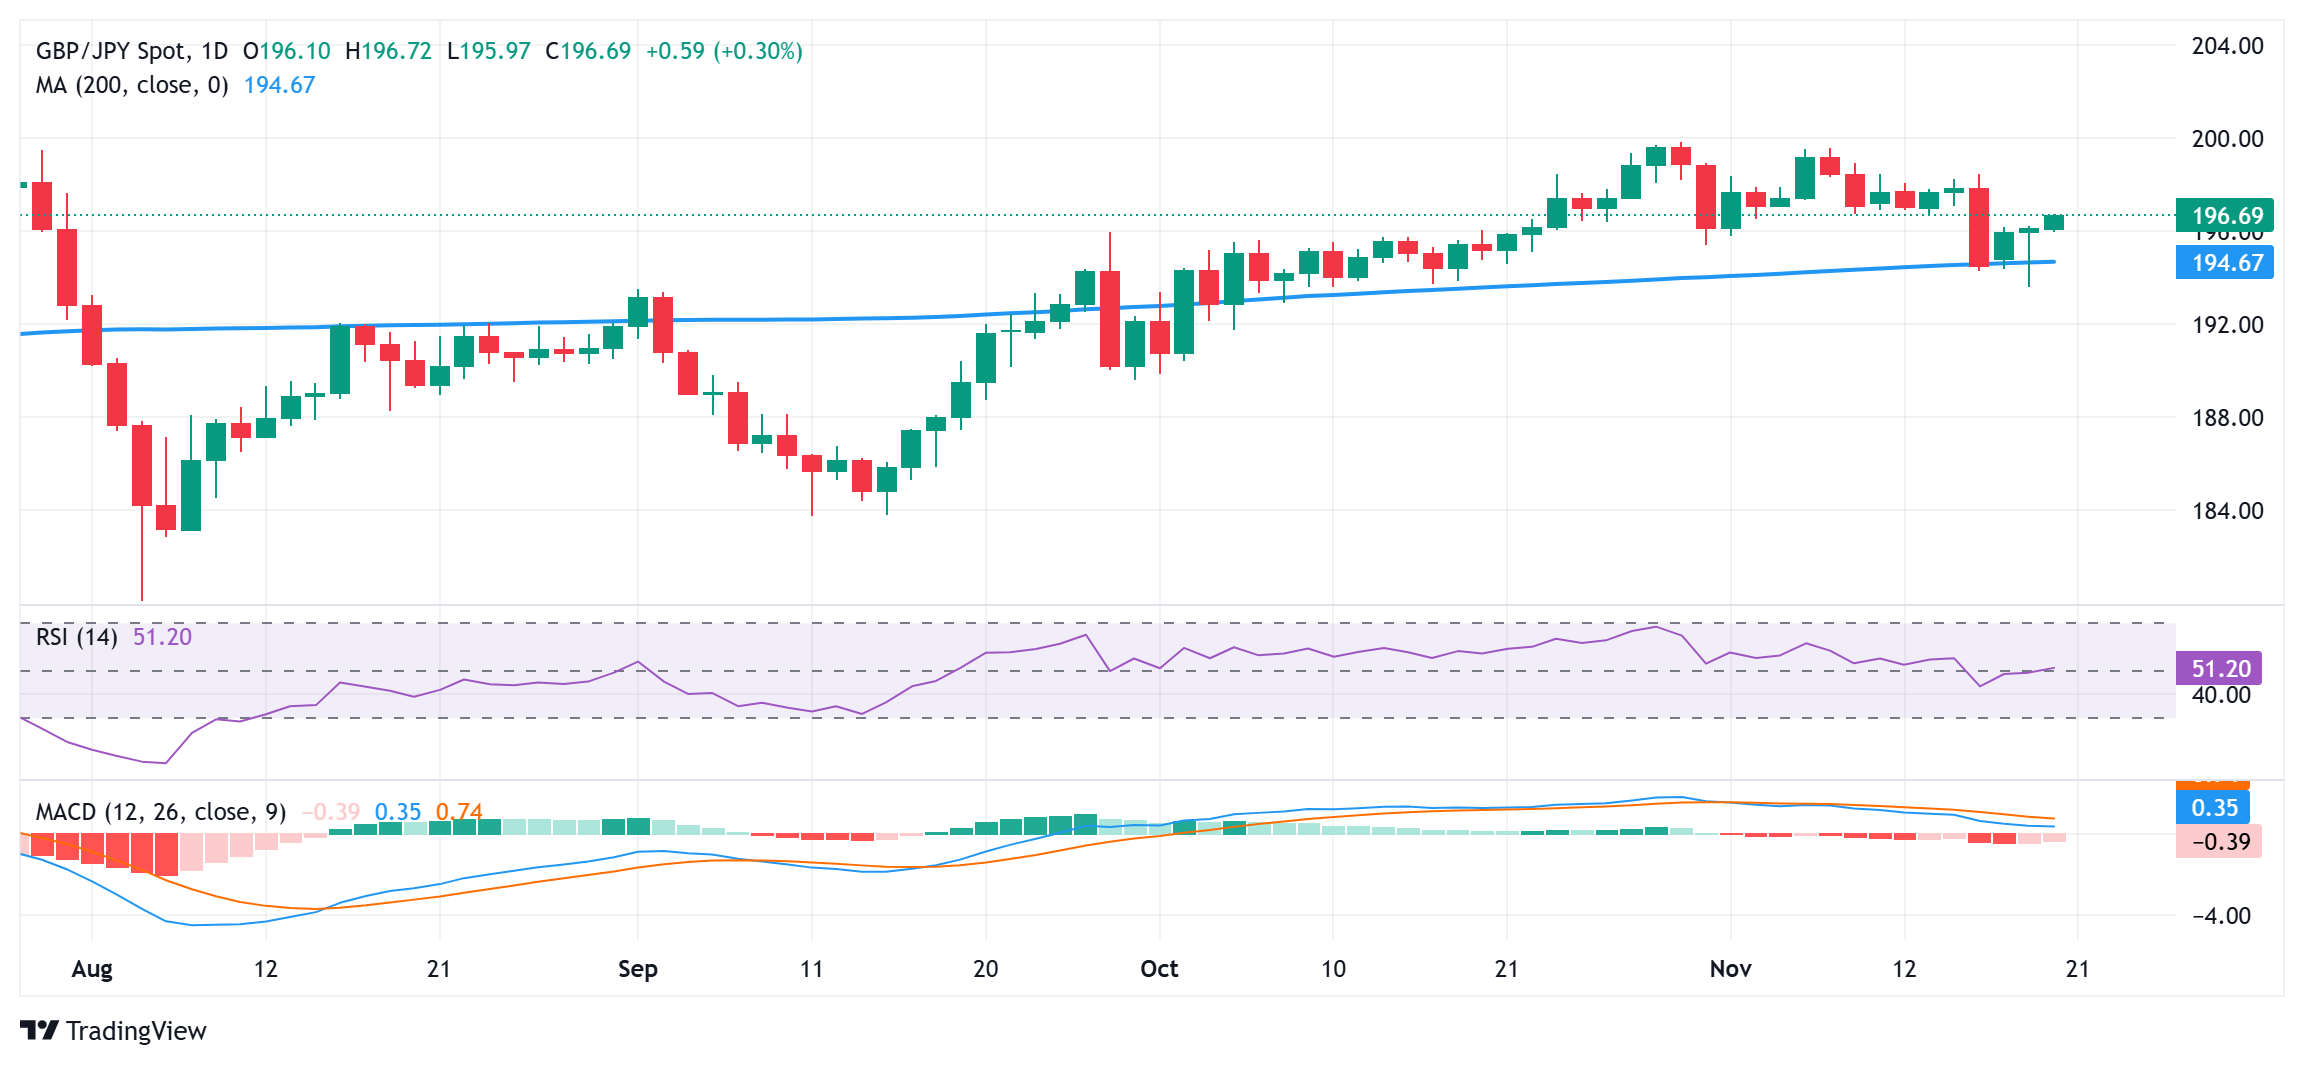
From a technical perspective, the GBP/JPY cross showed some resilience below the 200-day Simple Moving Average (SMA) on Tuesday and the subsequent strength favors bullish traders. Moreover, oscillators on the daily chart have recovered from lower levels, though they are yet to confirm a positive bias. Hence, any further move beyond the 197.00 mark is more likely to confront stiff resistance near the 197.70-197.80 supply zone. Some follow-through buying beyond the 198.00 round figure, however, will set the stage for additional near-term gains.
On the flip side, the 196.00 mark now seems to protect the immediate downside, below which the GBP/JPY cross could slide to the 195.40-195.35 support en route to sub-195.00 levels. The latter represents the very important 200-day SMA, which if broken could drag spot prices back towards the overnight swing low, around the 193.60-193.55 zone, with some intermediate support near the 194.00 round figure.
GBP/JPY daily chart
Economic Indicator
Consumer Price Index (YoY)
The United Kingdom (UK) Consumer Price Index (CPI), released by the Office for National Statistics on a monthly basis, is a measure of consumer price inflation – the rate at which the prices of goods and services bought by households rise or fall – produced to international standards. It is the inflation measure used in the government’s target. The YoY reading compares prices in the reference month to a year earlier. Generally, a high reading is seen as bullish for the Pound Sterling (GBP), while a low reading is seen as bearish.
Read more.Next release: Wed Nov 20, 2024 07:00
Frequency: Monthly
Consensus: 2.2%
Previous: 1.7%
Source: Office for National Statistics
The Bank of England is tasked with keeping inflation, as measured by the headline Consumer Price Index (CPI) at around 2%, giving the monthly release its importance. An increase in inflation implies a quicker and sooner increase of interest rates or the reduction of bond-buying by the BOE, which means squeezing the supply of pounds. Conversely, a drop in the pace of price rises indicates looser monetary policy. A higher-than-expected result tends to be GBP bullish.
Author

Haresh Menghani
FXStreet
Haresh Menghani is a detail-oriented professional with 10+ years of extensive experience in analysing the global financial markets.


