FAANGTastic Chart Analysis: FB, AAPL, AMZN, NFLX, GOOGL, TSLA key daily technical levels for May 21
- Big tech rallies from support regions as indices turn bullish again.
- Fed talks about thinking about talking about tapering!
- Equities rejoice that the Fed is not behind the curve.

Thursday was a strong day for equities as markets rallied in a bizarre twist. The last few weeks have been dominated by the narrative that markets were worried about inflation and potential interest rate rises. Now that the Fed minutes show even the slightest hint of an earlier than expected taper to bond purchases, equity markets decide everything is fine and rally anyway. Clearly, the market is doing what it wanted to do and moulding the narrative to suit its needs.
The big tech names as we have identified are all sitting on areas of strong support and duly used these to rally higher on Thursday. Tesla was the outperformer, spiking 4%, no surprise given its recent woes.
Let us dig in and see if the charts hold any insight.
Facebook (FB) stock forecast
Facebook has moved nicely from the down channel and is creating a new uptrend. Holding above the 9-day moving average to signify short-term bullishness. $321.47 is the next test, and a break of that could see a push to new highs.
The 9-day moving average as ever is key to short-term trading, so $313 is key. Below we have the lower trend line of the new up channel at $304, corresponding nicely to the horizontal support line. RSI and CCI are confirming the price action trending in line.
| Support | 313 | 298-296 | 285.78 | 278-200 day ma | 266-256 strong zone |
| Resistance | 321.47 | 331.81 | 331.81 |

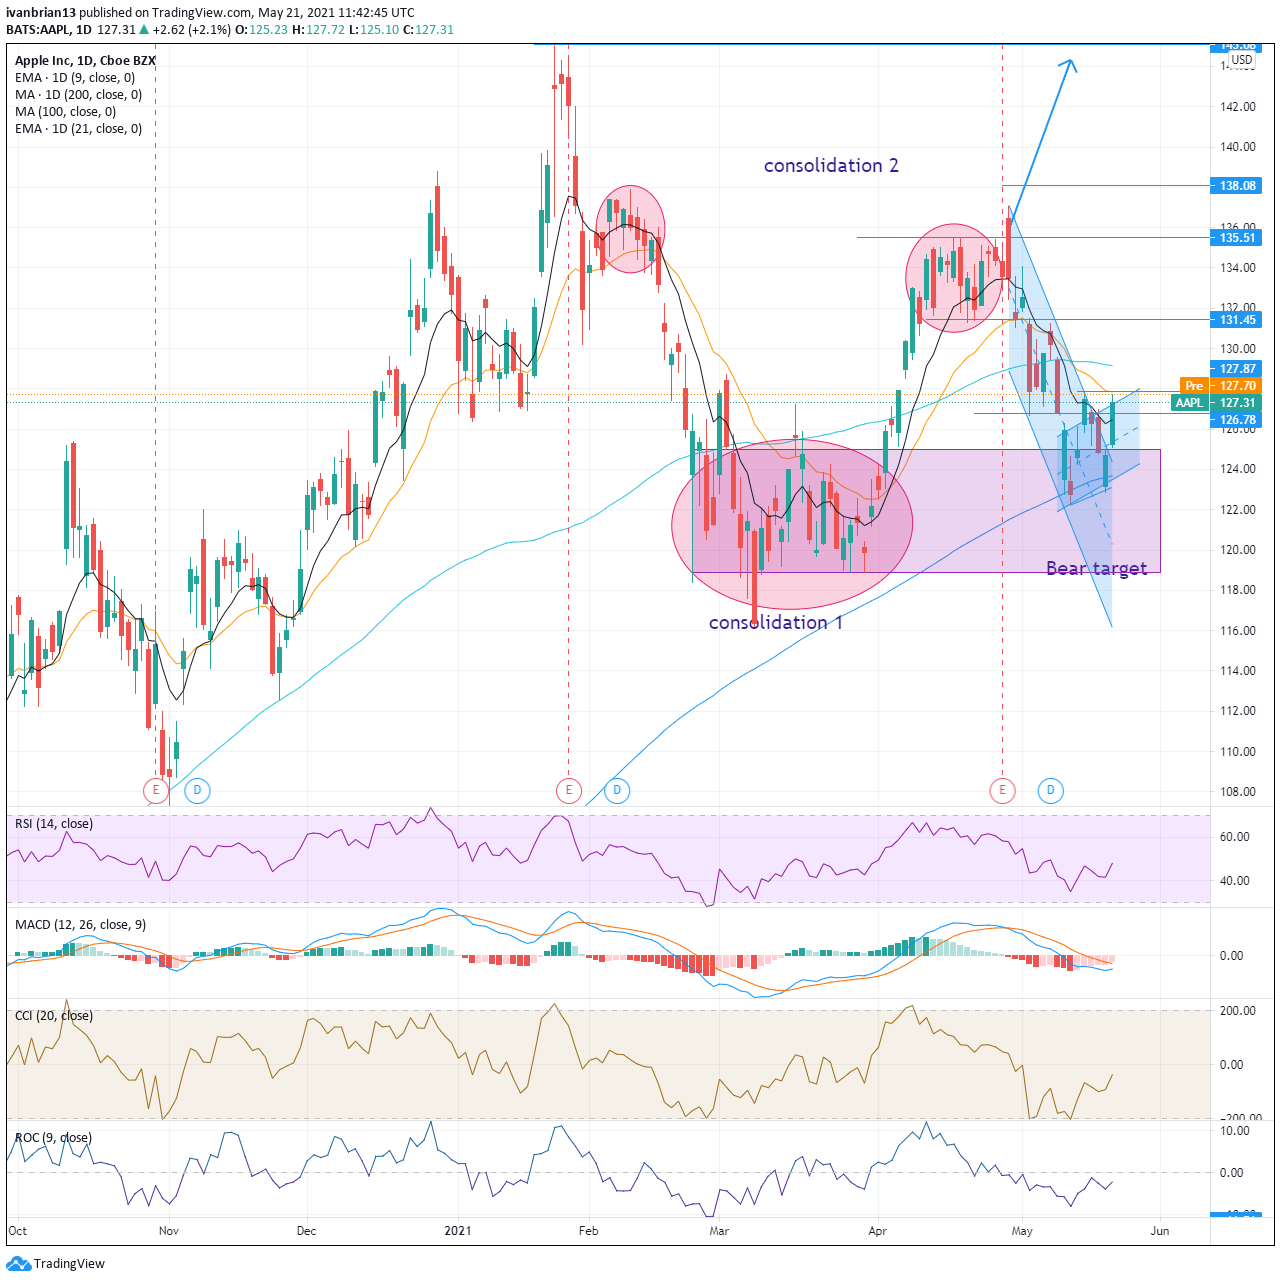
Apple (AAPL) stock forecast
Another nice move on Thursday and a solid bounce from the strong support region identified. AAPL shares tested the higher end of the new uptrend channel. This is the first resistance and the old high makes for a strong point of confluence at $127.87. Break this and a break of the next resistance at $131.45 is needed before AAPL looks properly bullish on the longer-term view. We can see the strong support area holding AAPL shares with the 200-day moving average and the consolidation area from March and April.
| Support | 124.94 | 123.69 200-day | 119 key | 116.99 | |
| Resistance | 127.87 pivot | 129.40 weak | 131.45 | 135.51 |
145.08 |
Amazon (AMZN) stock forecast
Amazon has been effectively stuck in a massive sideways range since Christmas, and nothing looks set to shake it just yet. The post-earnings top did look too stretched as RSI, CCI and ROC failed to make fresh highs to confirm the price high. AMZN shares have bounced from the strong confluence of support levels from the trend line at $3,161 and the 200-day moving average at $3,209. Breaking this should see a move to $2,883. A break of that and the next target is circa $2,400, a strong support region.
For now though, AMZN is neutral until it breaks the series of lower highs identified, currently this line is at $3,295. A break of this and AMZN will look to test the small price gap arrow shown. A break of this gap zone at $3,372 is needed for bullishness, and a break of $3,161-$3,208 could see bears push AMZN lower.
| Support | 3160 key | 3080 | 2883 | 2500 | 2300 | 2000 |
| Resistance | 3268 | 3295 | 3372 | 3434 | 3554 |

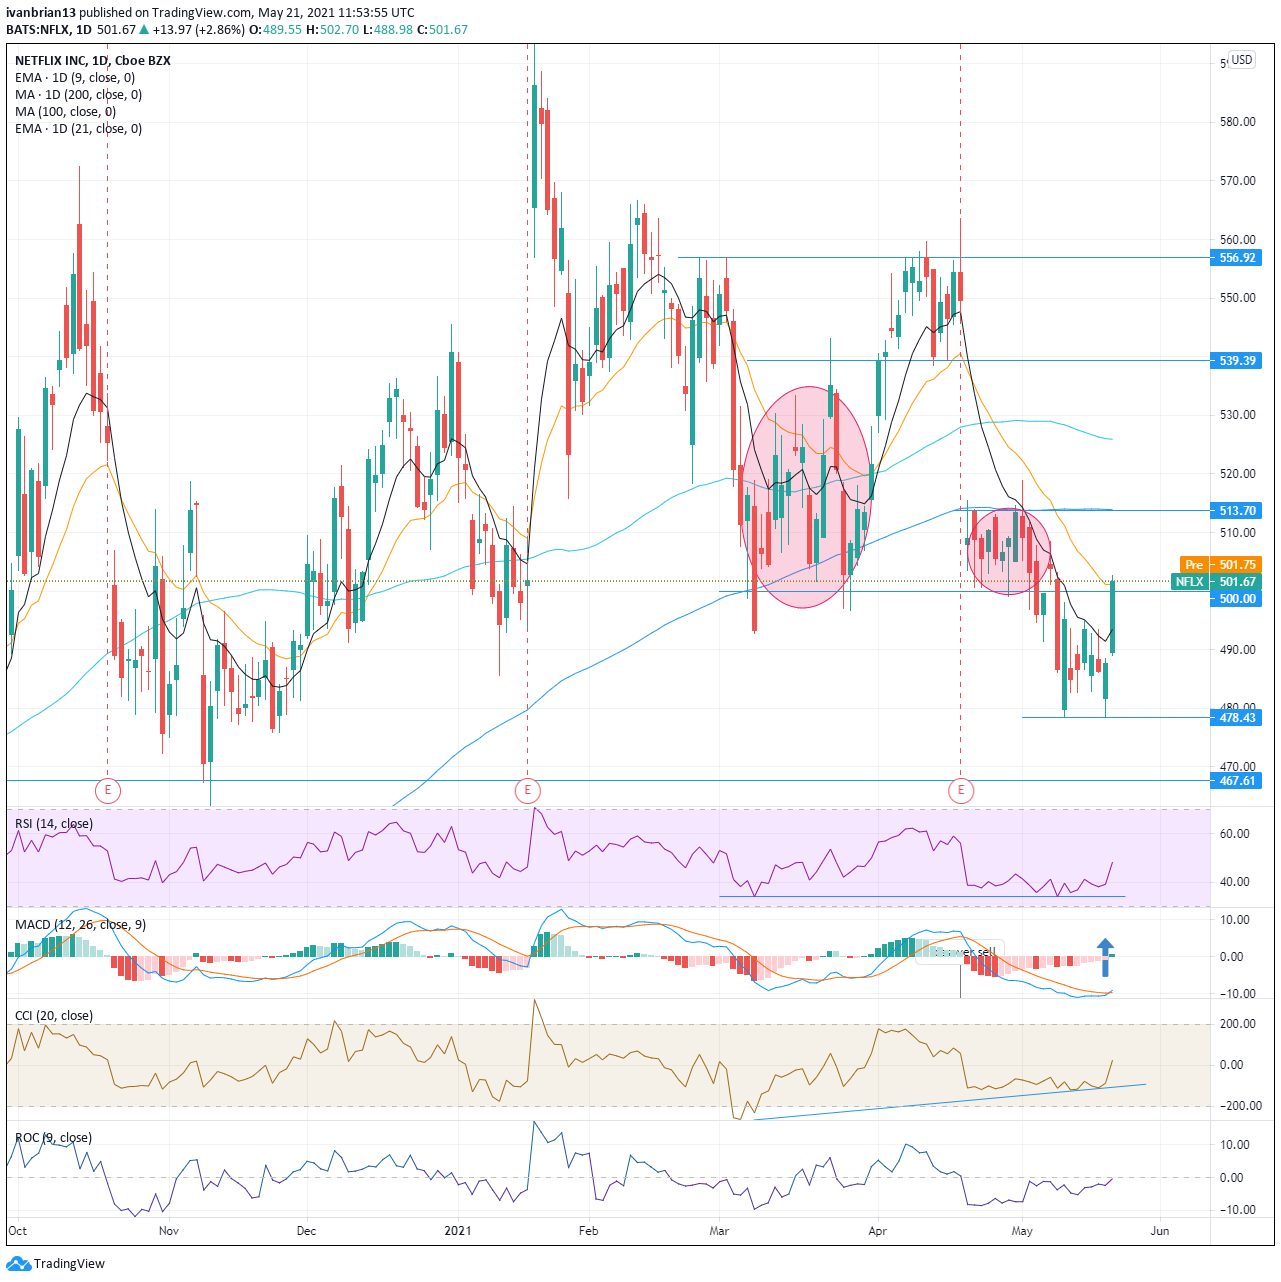
Netflix (NFLX) stock forecast
$513.70 is still the key level here. Hold below and NFLX is bearish. Break and the stock should fill the earnings gap up to $539. On Tuesday, FXStreet wrote, "A small long might work for a pop to $500 as the RSI, CCI and ROC have diverged from the price." Nice when they work sometimes, and NFLX has now stalled at the 21-day moving average. A little congestion area could see the price move slow here, but a break of $513.70 is still the bulls' goal. The MACD has also given a crossover buy signal, further adding to the potential of a swing play.
A break of $478 will lead to a test of $467. If that breaks, then we will likely see a test of the $420 support region, which is highlighted.
| Support | 467 | 420 | 400 | 380 | 360 | |
| Resistance | 492 9-day | 500 | 514 200-day MA | 540 | 556.92 | 593.29 |
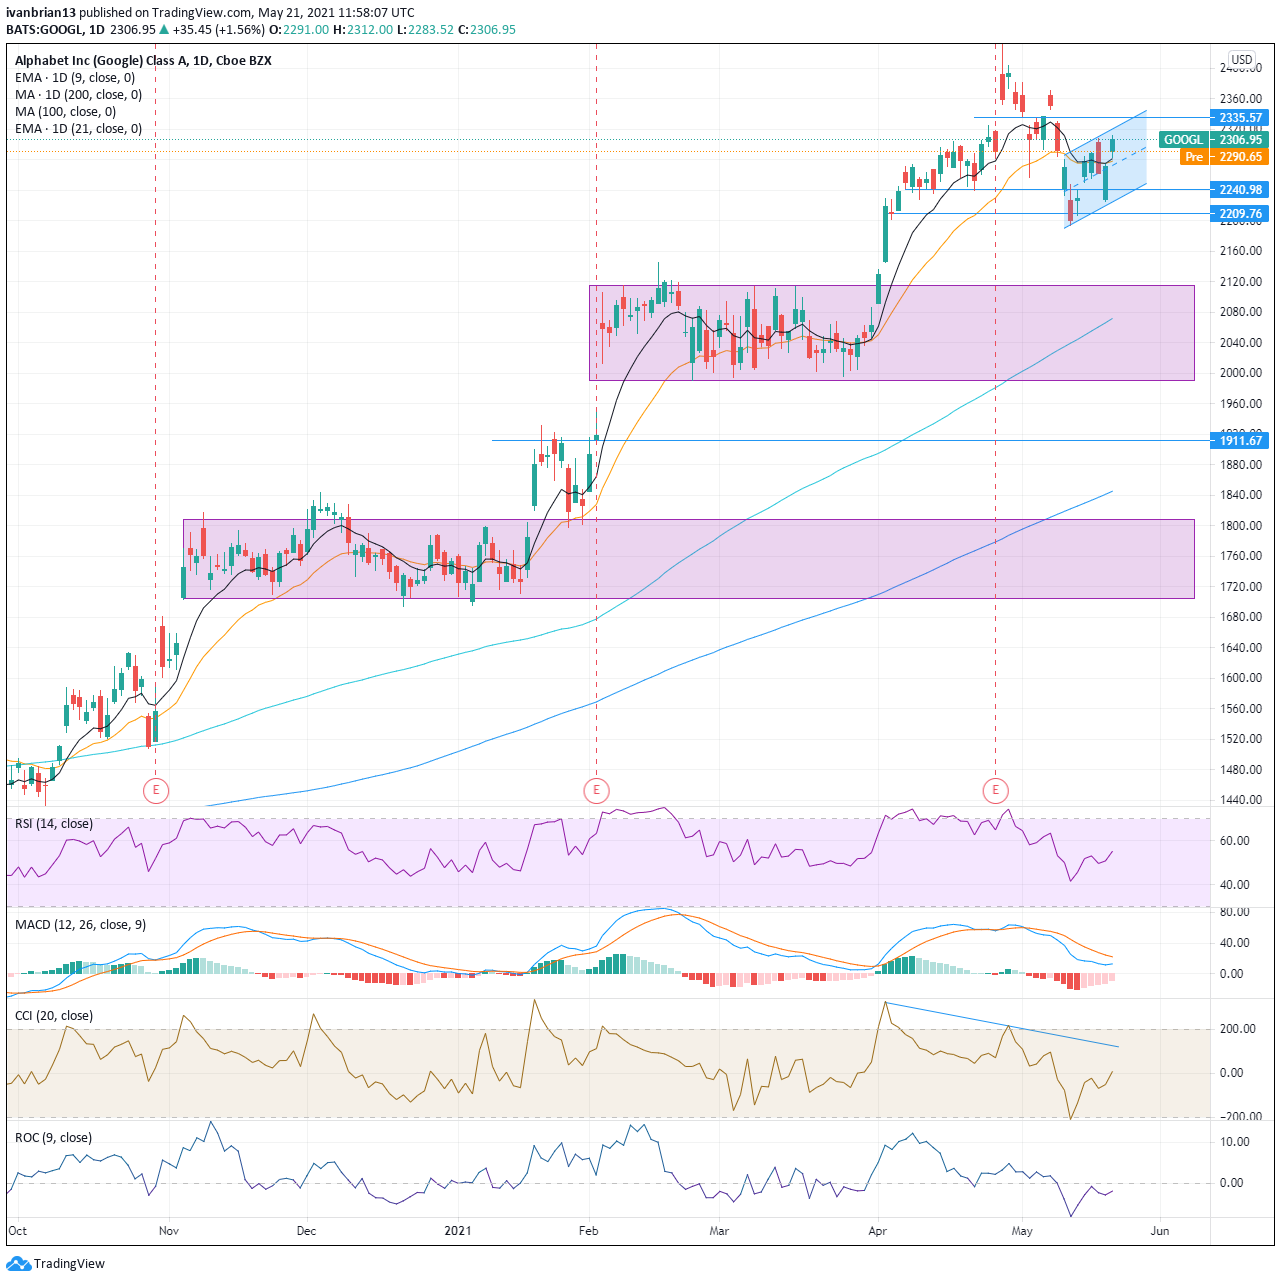
Google (GOOGL) stock forecast
Google also bounces from a strong support zone, putting in a new uptrend channel. $2,335 is the next target. GOOGL has bounced from support at $2,209 and also broken back above the 9 and 21-day moving averages. The short-term trend is moderately bullish. $2,335 could see a test, and a break should really see new highs. The MACD has yet to confirm this latent bullish trend, so this would be an added help if it does confirm shortly. Both RSI and CCI are confirming, both trending higher with the price. The one fear is that staying in this $2,240-$2,335 range creates a head-and-shoulders formation with bearish connotations and a target toward $2,000. Again, there is nothing too high conviction showing. Breaks of $2,209 or $2,335 are the bearish and bullish pivots. Strong support regions are highlighted at $2,100-$2,000 and $1,800-$1,700.
| Support | 2241 | 2209 | 2100 | 2000 | 1911 weak | 1800 | 1700 |
| Resistance | 2335 | 3431 | 2500 |
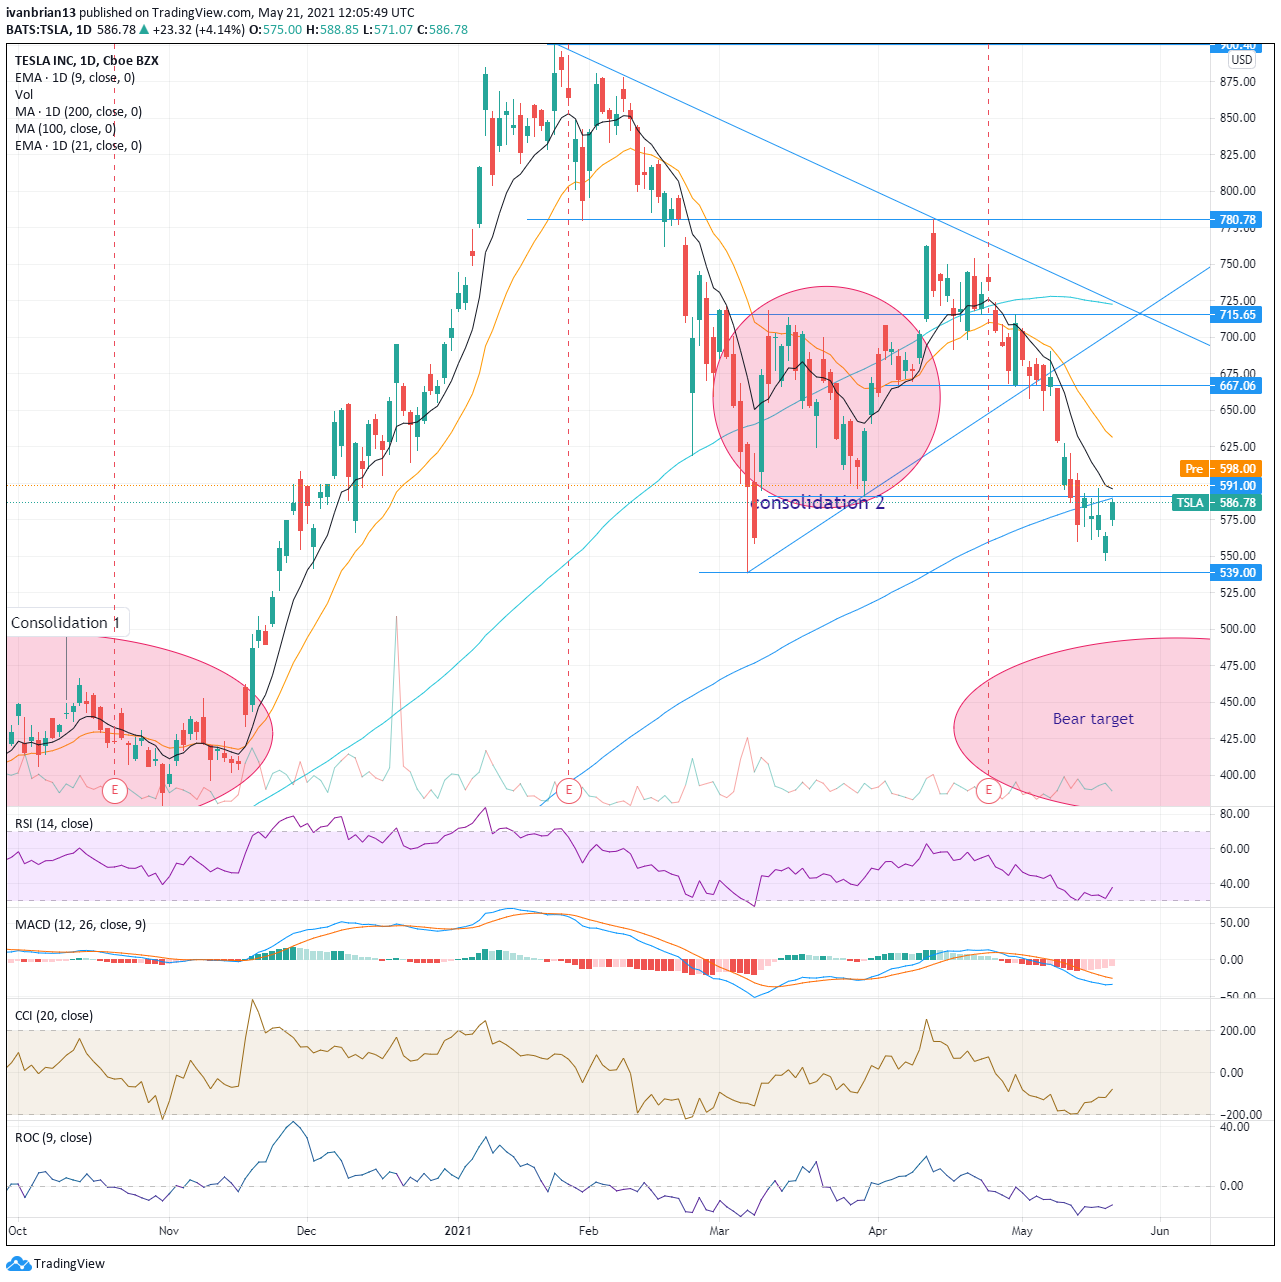
Tesla (TSLA) stock forecast
A beautiful move from Tesla on Thursday sees it retrace up to the 200-day moving average at $590. This is now the key level, and it has a confluence of resistance with the $591 line identified. A break of this and the nearby 9-day moving average will turn the recent bearish tide back in favour of the bulls. A break above $591 could accelerate to $625 as there is not much volume despite the steep fall, so this might be a form of vacuum. Failure to break $539 can also be taken as a victory for bulls on the longer-term horizon as it will result in a higher low, albeit only marginally (but they still count). $539 is now the key. With a break, it probably sees Tesla slip further to our bear target. Hold and Tesla can stabilize. and breaking $625 sees bulls back in control. The momentum oscillators RSI, CCI and ROC have all been close to or signalling oversold conditions recently.
| Support | 539 | 500 | 465 | 430 | ||
| Resistance | 590 200-day | 591 | 625 | 667 | 715 | 781 |
At the time of writing, the author has no position in any stock mentioned in this article and no business relationship with any company mentioned. The author has not received compensation for writing this article, other than from FXStreet.
This article is for information purposes only. The author and FXStreet are not registered investment advisors and nothing in this article is intended to be investment advice. It is important to perform your own research before making any investment and take independent advice from a registered investment advisor.
FXStreet and the author do not provide personalized recommendations. The author makes no representations as to accuracy, completeness, or the suitability of this information. FXStreet and the author will not be liable for any errors, omissions or any losses, injuries or damages arising from this information and its display or use. The author will not be held responsible for information that is found at the end of links posted on this page.
Errors and omissions excepted.
Premium
You have reached your limit of 3 free articles for this month.
Start your subscription and get access to all our original articles.
Author

Ivan Brian
FXStreet
Ivan Brian started his career with AIB Bank in corporate finance and then worked for seven years at Baxter. He started as a macro analyst before becoming Head of Research and then CFO.


