Eurozone Preliminary HICP inflation eases to 2.4% YoY in March vs. 2.6% forecast

The Eurozone annual Harmonized Index of Consumer Prices (HICP) rose 2.4% in March, slowing from a 2.6% increase in February, according to the official data released by Eurostat on Wednesday. The reading missed the market consensus for a 2.6% growth in the reported period.
The Core HICP inflation softened to 2.9% YoY in March, as against February’s 3.1% rise while missing the estimates of 3.0%.
On a monthly basis, the bloc’s HICP rose 0.8% in February vs. a 0.6% jump registered in February. The core HICP inflation came in at +1.1% MoM in the same period, compared to a 0.7% rebound seen previously.
The European Central Bank’s (ECB) inflation target is 2.0%. The old continent’s HICP inflation data have a significant impact on the market’s pricing of the ECB interest rate outlook.
Key details from the Eurozone inflation report (via Eurostat)
Looking at the main components of euro area inflation, services is expected to have the highest annual rate in March (4.0%, stable compared with February), followed by food, alcohol & tobacco (2.7%, compared with 3.9% in February), non-energy industrial goods (1.1%, compared with 1.6% in February) and energy (-1.8%, compared with -3.7% in February).
Separately, the Eurozone Unemployment Rate steadied at 6.5% in February vs. January’s revised 6.5% print.
EUR/USD reaction to the Eurozone inflation report
The Euro is unfazed by the softer-than-expected Eurozone inflation data. EUR/USD is trading almost unchanged on the day at 1.0770, at the press time.
(This story was corrected on Wednesday at 09:19 GMT to say that "Separately, the Eurozone Unemployment Rate steadied at 6.5% in February," not 6.54%)
Euro price today
The table below shows the percentage change of Euro (EUR) against listed major currencies today. Euro was the strongest against the Japanese Yen.
| USD | EUR | GBP | CAD | AUD | JPY | NZD | CHF | |
| USD | -0.04% | -0.01% | 0.12% | 0.11% | 0.13% | 0.07% | 0.05% | |
| EUR | 0.05% | 0.02% | 0.16% | 0.14% | 0.17% | 0.10% | 0.08% | |
| GBP | 0.01% | -0.02% | 0.13% | 0.11% | 0.15% | 0.07% | 0.06% | |
| CAD | -0.12% | -0.15% | -0.13% | -0.03% | 0.01% | -0.05% | -0.07% | |
| AUD | -0.12% | -0.13% | -0.11% | 0.03% | 0.04% | -0.03% | -0.05% | |
| JPY | -0.13% | -0.16% | -0.17% | -0.02% | -0.04% | -0.08% | -0.09% | |
| NZD | -0.06% | -0.10% | -0.07% | 0.06% | 0.03% | 0.07% | -0.01% | |
| CHF | -0.06% | -0.11% | -0.06% | 0.07% | 0.06% | 0.08% | 0.02% |
The heat map shows percentage changes of major currencies against each other. The base currency is picked from the left column, while the quote currency is picked from the top row. For example, if you pick the Euro from the left column and move along the horizontal line to the Japanese Yen, the percentage change displayed in the box will represent EUR (base)/JPY (quote).
This section below was published at 05:00 GMT to preview the Eurozone inflation data.
- Eurostat is set to release key Europe inflation data on Wednesday.
- Headline annual inflation is seen holding steady at 2.6% in March.
- The European Central Bank (ECB) is expected to cut rates in June.
The Harmonized Index of Consumer Prices (HICP), a measure of inflation for the Eurozone, will be released on Wednesday, April 3. The inflation data from the old continent will be closely scrutinized by the European Central Bank (ECB) against rising speculation that the bank could start its easing cycle as soon as at its June event.
A glimpse at recent European data saw consumer prices in the euro bloc climb at an annualized 2.9% in the year to December 2023, just to recede in the subsequent two months to 2.8% and 2.6%, a move that mirrored other G10 nations.
In her last comments on March 20, ECB’s President Christine Lagarde expressed difficulty in determining whether the current price pressures stem merely from delays in adjusting wages and services prices, combined with the cyclical fluctuations in productivity, or if they indicate persistent inflationary trends.
Lagarde added that, unlike previous phases of their policy cycle, there are indications that the anticipated disinflationary trajectory will persist. Should the data unveil a significant correlation between the underlying inflation trend and the ECB projections, Lagarde thinks the bank can transition into the phase of scaling back its policy measures.
What to expect in the next European inflation report?
As a result, economists anticipate that Core HICP inflation will rise by 3.0% on a yearly basis in March (from 3.1%), while the headline gauge is seen rising by 2.6% from a year earlier, matching the gain observed in the previous month.
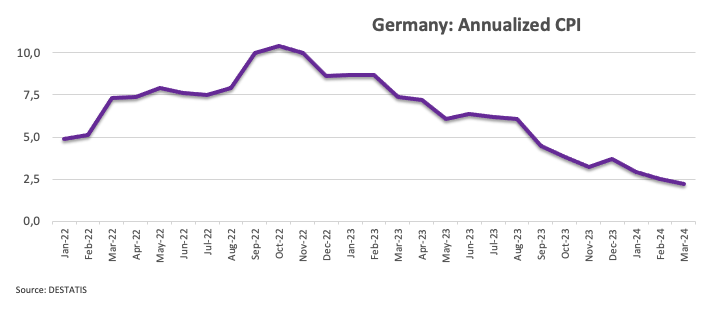
Reinforcing the idea of persistent disinflationary pressures, the advanced Consumer Price Index (CPI) in Germany rose by 2.2% on a yearly basis in March, down from February’s 2.5% gain.
According to the ECB Consumer Expectations Survey (CES), the median predictions for inflation in the next 12 months dropped from 3.3% to 3.1%. However, expectations for inflation three years ahead stayed steady at 2.5%.
When will the Harmonised Index of Consumer Prices report be released and how could it affect EUR/USD?
Eurozone preliminary HICP is due to be published at 09:00 GMT on Wednesday.
Heading into the highly-anticipated inflation release from Europe, the Euro (EUR) is struggling below the round milestone of 1.0800 against the US Dollar (USD), as investors continue to assess the likelihood of the start of the easing cycle by the Federal Reserve (Fed) in June.
According to Pablo Piovano, Senior Analyst at FXStreet, “Looking ahead, the EUR/USD is anticipated to encounter initial resistance at the key 200-day SMA at 1.0833. A move above this zone in a convincing fashion should restore the constructive bias and potentially allow for further gains in the short-term horizon.”
Pablo adds, “On the flip side, a reach of the so-far April low of 1.0724 (April 2) could trigger a deeper decline towards the 2024 low of 1.0694 (February 14).”
Inflation FAQs
Inflation measures the rise in the price of a representative basket of goods and services. Headline inflation is usually expressed as a percentage change on a month-on-month (MoM) and year-on-year (YoY) basis. Core inflation excludes more volatile elements such as food and fuel which can fluctuate because of geopolitical and seasonal factors. Core inflation is the figure economists focus on and is the level targeted by central banks, which are mandated to keep inflation at a manageable level, usually around 2%.
The Consumer Price Index (CPI) measures the change in prices of a basket of goods and services over a period of time. It is usually expressed as a percentage change on a month-on-month (MoM) and year-on-year (YoY) basis. Core CPI is the figure targeted by central banks as it excludes volatile food and fuel inputs. When Core CPI rises above 2% it usually results in higher interest rates and vice versa when it falls below 2%. Since higher interest rates are positive for a currency, higher inflation usually results in a stronger currency. The opposite is true when inflation falls.
Although it may seem counter-intuitive, high inflation in a country pushes up the value of its currency and vice versa for lower inflation. This is because the central bank will normally raise interest rates to combat the higher inflation, which attract more global capital inflows from investors looking for a lucrative place to park their money.
Formerly, Gold was the asset investors turned to in times of high inflation because it preserved its value, and whilst investors will often still buy Gold for its safe-haven properties in times of extreme market turmoil, this is not the case most of the time. This is because when inflation is high, central banks will put up interest rates to combat it. Higher interest rates are negative for Gold because they increase the opportunity-cost of holding Gold vis-a-vis an interest-bearing asset or placing the money in a cash deposit account. On the flipside, lower inflation tends to be positive for Gold as it brings interest rates down, making the bright metal a more viable investment alternative.
Author
FXStreet Team
FXStreet
Composed of a group of economic journalists and FX experts, the FXStreet content team produces and oversees all content published on FXStreet. It provides a purely journalistic approach to the Forex market.


