EUR/USD retests 1.05 ahead of US CPI inflation, ECB rate call in the barrel
- EUR/USD softened further on Tuesday, testing 1.0500 once again.
- The Fiber pair has closed slightly lower for a third straight day.
- Euro traders are bracing for back-to-back key data prints.

EUR/USD shed close to 0.2% on Tuesday, chalking in a third straight declining trading day and testing down into the 1.0500 handle as the Euro’s near-term bullish recovery fizzles out. Fiber is backsliding into a cautious stance ahead of a key US Consumer Price Index (CPI) inflation print due on Wednesday, with another rate call from the European Central Bank (ECB) just around the corner on Thursday.
Wednesday’s CPI inflation print, which serves as one of the last key data releases before the Federal Reserve’s (Fed) last policy meeting in 2024. Signs that progress on inflation has stalled could kill hopes for a third consecutive rate cut on December 18. At the current cut, Wednesday’s US CPI inflation for November is expected to rise slightly to 2.7% YoY from the previous 2.6%, while core annualized CPI is forecast to hold steady at 3.3%.
According to the CME’s FedWatch Tool, rate traders are pricing on 85% odds of one last quarter-point rate cut for the year.
The ECB’s latest rate call is set for Thursday, and the rate meeting is widely expected to deliver another quarter-point cut to investors. The ECB’s Main Refinancing Operations Rate is forecast to get trimmed to 3.15% from 3.4%, while the ECB Rate on Deposit Facility is anticipated to decline to a flat 3.0% from 3.25%.
EUR/USD price forecast
The EUR/USD daily chart highlights the continuation of a bearish medium-term trend, as the pair remains comfortably below the 50-day EMA at 1.0696 and the 200-day EMA at 1.0826. After the sharp sell-off in November, which saw the pair plunge to a multi-month low near 1.0450, EUR/USD has been consolidating in a tight range. Recent attempts to reclaim the 1.0600 handle have faltered, underscoring the strength of the prevailing bearish sentiment. The broader downtrend remains intact, with lower highs and lower lows defining price action since late October.
The most recent candle closed with a bearish tone at 1.0531, marking a decline of 0.18% on the day. Despite a brief attempt to push higher during the session, the pair failed to sustain momentum above 1.0560, resulting in a long upper wick and signaling selling pressure. Key support at 1.0500 is now back in focus, with a break below this level likely to expose the November low of 1.0450. Conversely, immediate resistance resides at 1.0600, with the descending 50-day EMA adding to the challenge for bulls.
The MACD histogram remains slightly positive but is flattening, indicating fading bullish momentum from the recent rebound. Furthermore, the MACD line is below the signal line, suggesting bearish control persists. To shift sentiment, bulls need a clear break above 1.0600, which could spark a recovery toward 1.0700. However, failure to hold above 1.0500 would likely confirm the bearish trend, paving the way for an extension toward 1.0400 in the coming sessions.
EUR/USD daily chart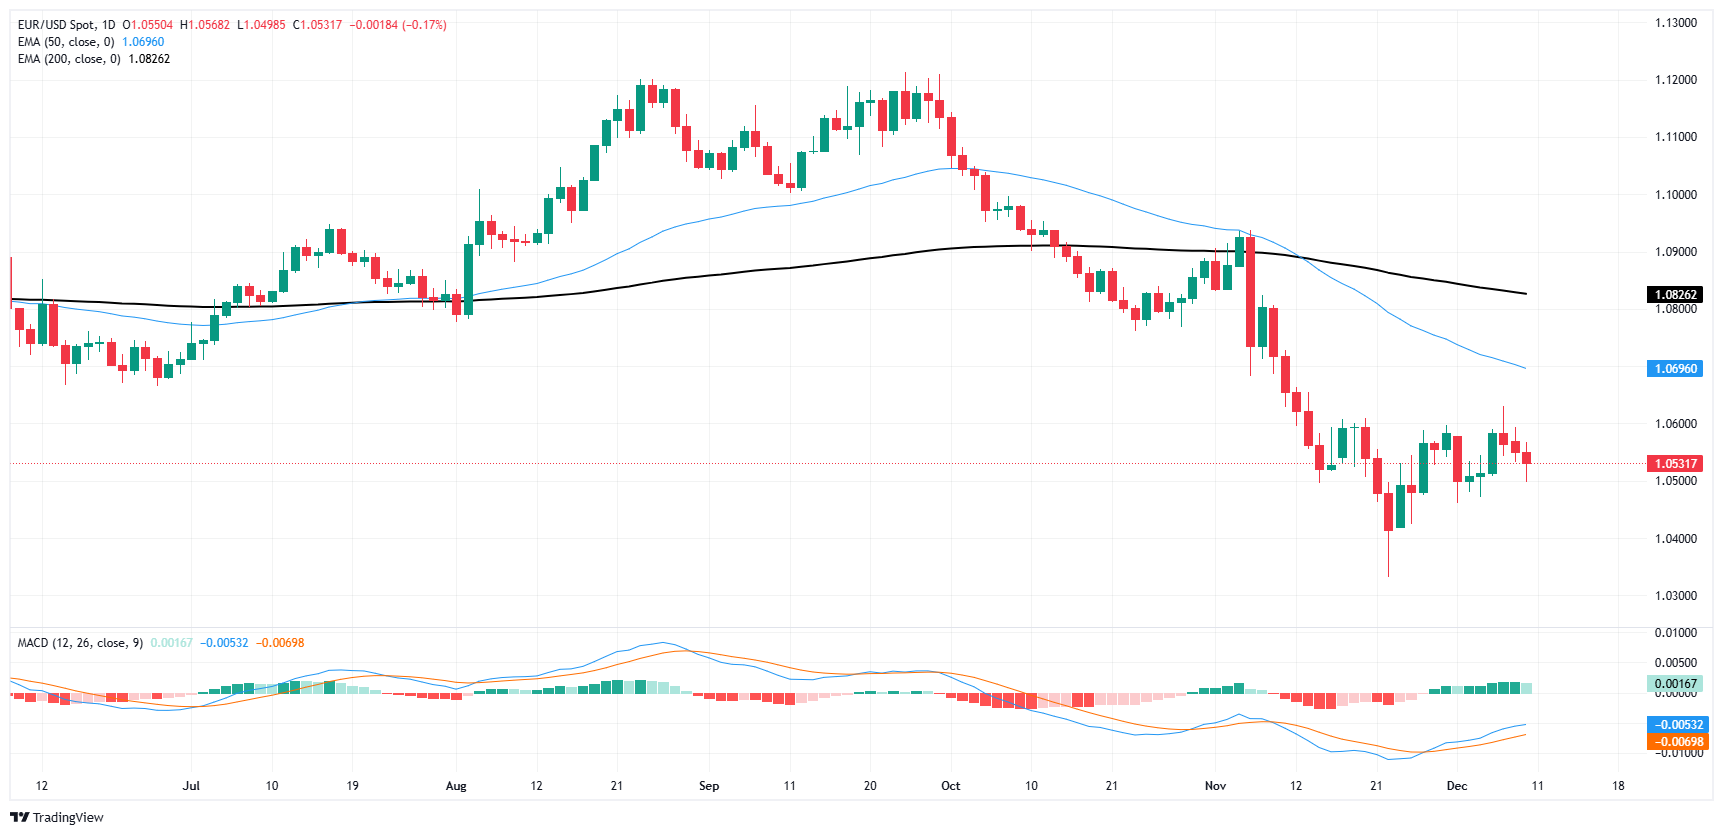
Euro FAQs
The Euro is the currency for the 20 European Union countries that belong to the Eurozone. It is the second most heavily traded currency in the world behind the US Dollar. In 2022, it accounted for 31% of all foreign exchange transactions, with an average daily turnover of over $2.2 trillion a day, according to data from the Bank of International Settlements. EUR/USD is the most heavily traded currency pair in the world, accounting for an estimated 30% of all transactions, followed by EUR/JPY (4%), EUR/GBP (3%) and EUR/AUD (2%).
Author

Joshua Gibson
FXStreet
Joshua joins the FXStreet team as an Economics and Finance double major from Vancouver Island University with twelve years' experience as an independent trader focusing on technical analysis.


