EUR/USD pushed into a fifth straight loss, falls below 1.05 again
- EUR/USD backslid 0.2% on Thursday, shedding the 1.0500 handle.
- The ECB delivered a widely-expected double rate cut on Thursday.
- Tepid data docket awaits Fiber traders on Friday.

EUR/USD backslid a fifth straight trading day on Thursday, falling another one-fifth of one percent and declining further away from 1.0500. Fiber eased lower for for a fifth consecutive trading day after the European Central Bank (ECB) trimmed interest rates by another 25 bps, with broader market sentiment keeping one foot firmly in the Greenback for the day.
The ECB lowered its main reference rates by another quarter-point, trimming market support for the battered Euro. Friday will be a notably quiet note on the data docket, forcing traders to sit and wait until next week’s Purchasing Managers Index (PMI).
US PPI inflation bucked to 0.4% in November, while October’s print was retroactively adjusted to 0.3% from 0.2% MoM. Markets were expecting a print no higher than 0.2% MoM. Core PPI inflation accelerated to 3.4% on an annualized basis, over and above the expected uptick to 3.2% from the previous 3.1% YoY.
Investor sentiment froze in its tracks on Thursday post-PPI inflation print, however market expectations for the Fed’s December 18 rate call have hardened around the 25 bps mark. According to the CME’s FedWatch Tool, rate traders are now pricing in over 98% odds of a quarter-point rate cut when the Federal Open Market Committee (FOMC) convenes in December 18.
EUR/USD price forecast
The EUR/USD daily chart highlights a persistent bearish trend, with the pair trading below both the 50-day EMA at 1.0679 and the 200-day EMA at 1.0819. This alignment of moving averages points to sustained downside pressure, as sellers have maintained control since the sharp breakdown in early November. The MACD indicator remains in bearish territory, with its signal line hovering below zero, further validating the downward momentum.
The latest candlestick—a small-bodied red candle—underscores the lack of bullish conviction as the pair hovers near the 1.0470 region. This area serves as immediate support, but a clear break lower could expose the year-to-date low around 1.0400. On the upside, resistance is capped by the 1.0500 psychological level, with the 50-day EMA providing a stronger barrier. The overall structure suggests that any recovery attempts are likely to be short-lived unless the pair can reclaim the 1.0600 handle. For now, the bears remain in control, with a clear focus on the downside.
EUR/USD daily chart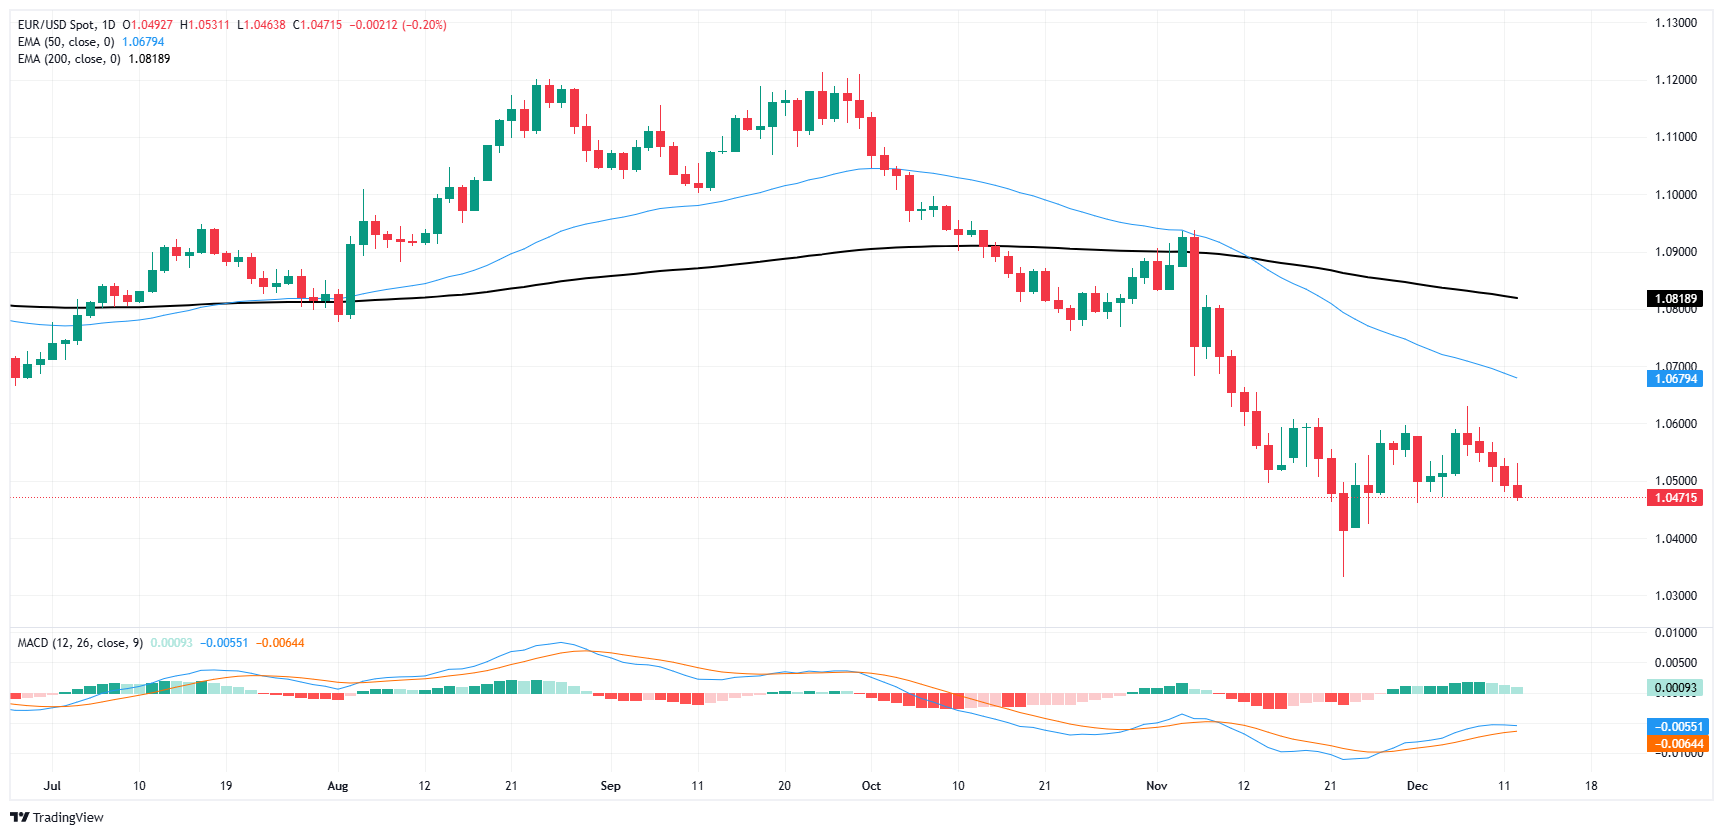
Euro FAQs
The Euro is the currency for the 20 European Union countries that belong to the Eurozone. It is the second most heavily traded currency in the world behind the US Dollar. In 2022, it accounted for 31% of all foreign exchange transactions, with an average daily turnover of over $2.2 trillion a day, according to data from the Bank of International Settlements. EUR/USD is the most heavily traded currency pair in the world, accounting for an estimated 30% of all transactions, followed by EUR/JPY (4%), EUR/GBP (3%) and EUR/AUD (2%).
Author

Joshua Gibson
FXStreet
Joshua joins the FXStreet team as an Economics and Finance double major from Vancouver Island University with twelve years' experience as an independent trader focusing on technical analysis.


