EUR/USD Price Analysis: Stuck in a range below 100-hour SMA pivotal resistance
- EUR/USD struggles for a firm intraday direction and remains confined in a narrow band.
- The technical setup favours bulls and supports prospects for some meaningful upside.
- Rising bets for a rate cut by the Fed and the ECB in June keep traders on the sidelines.

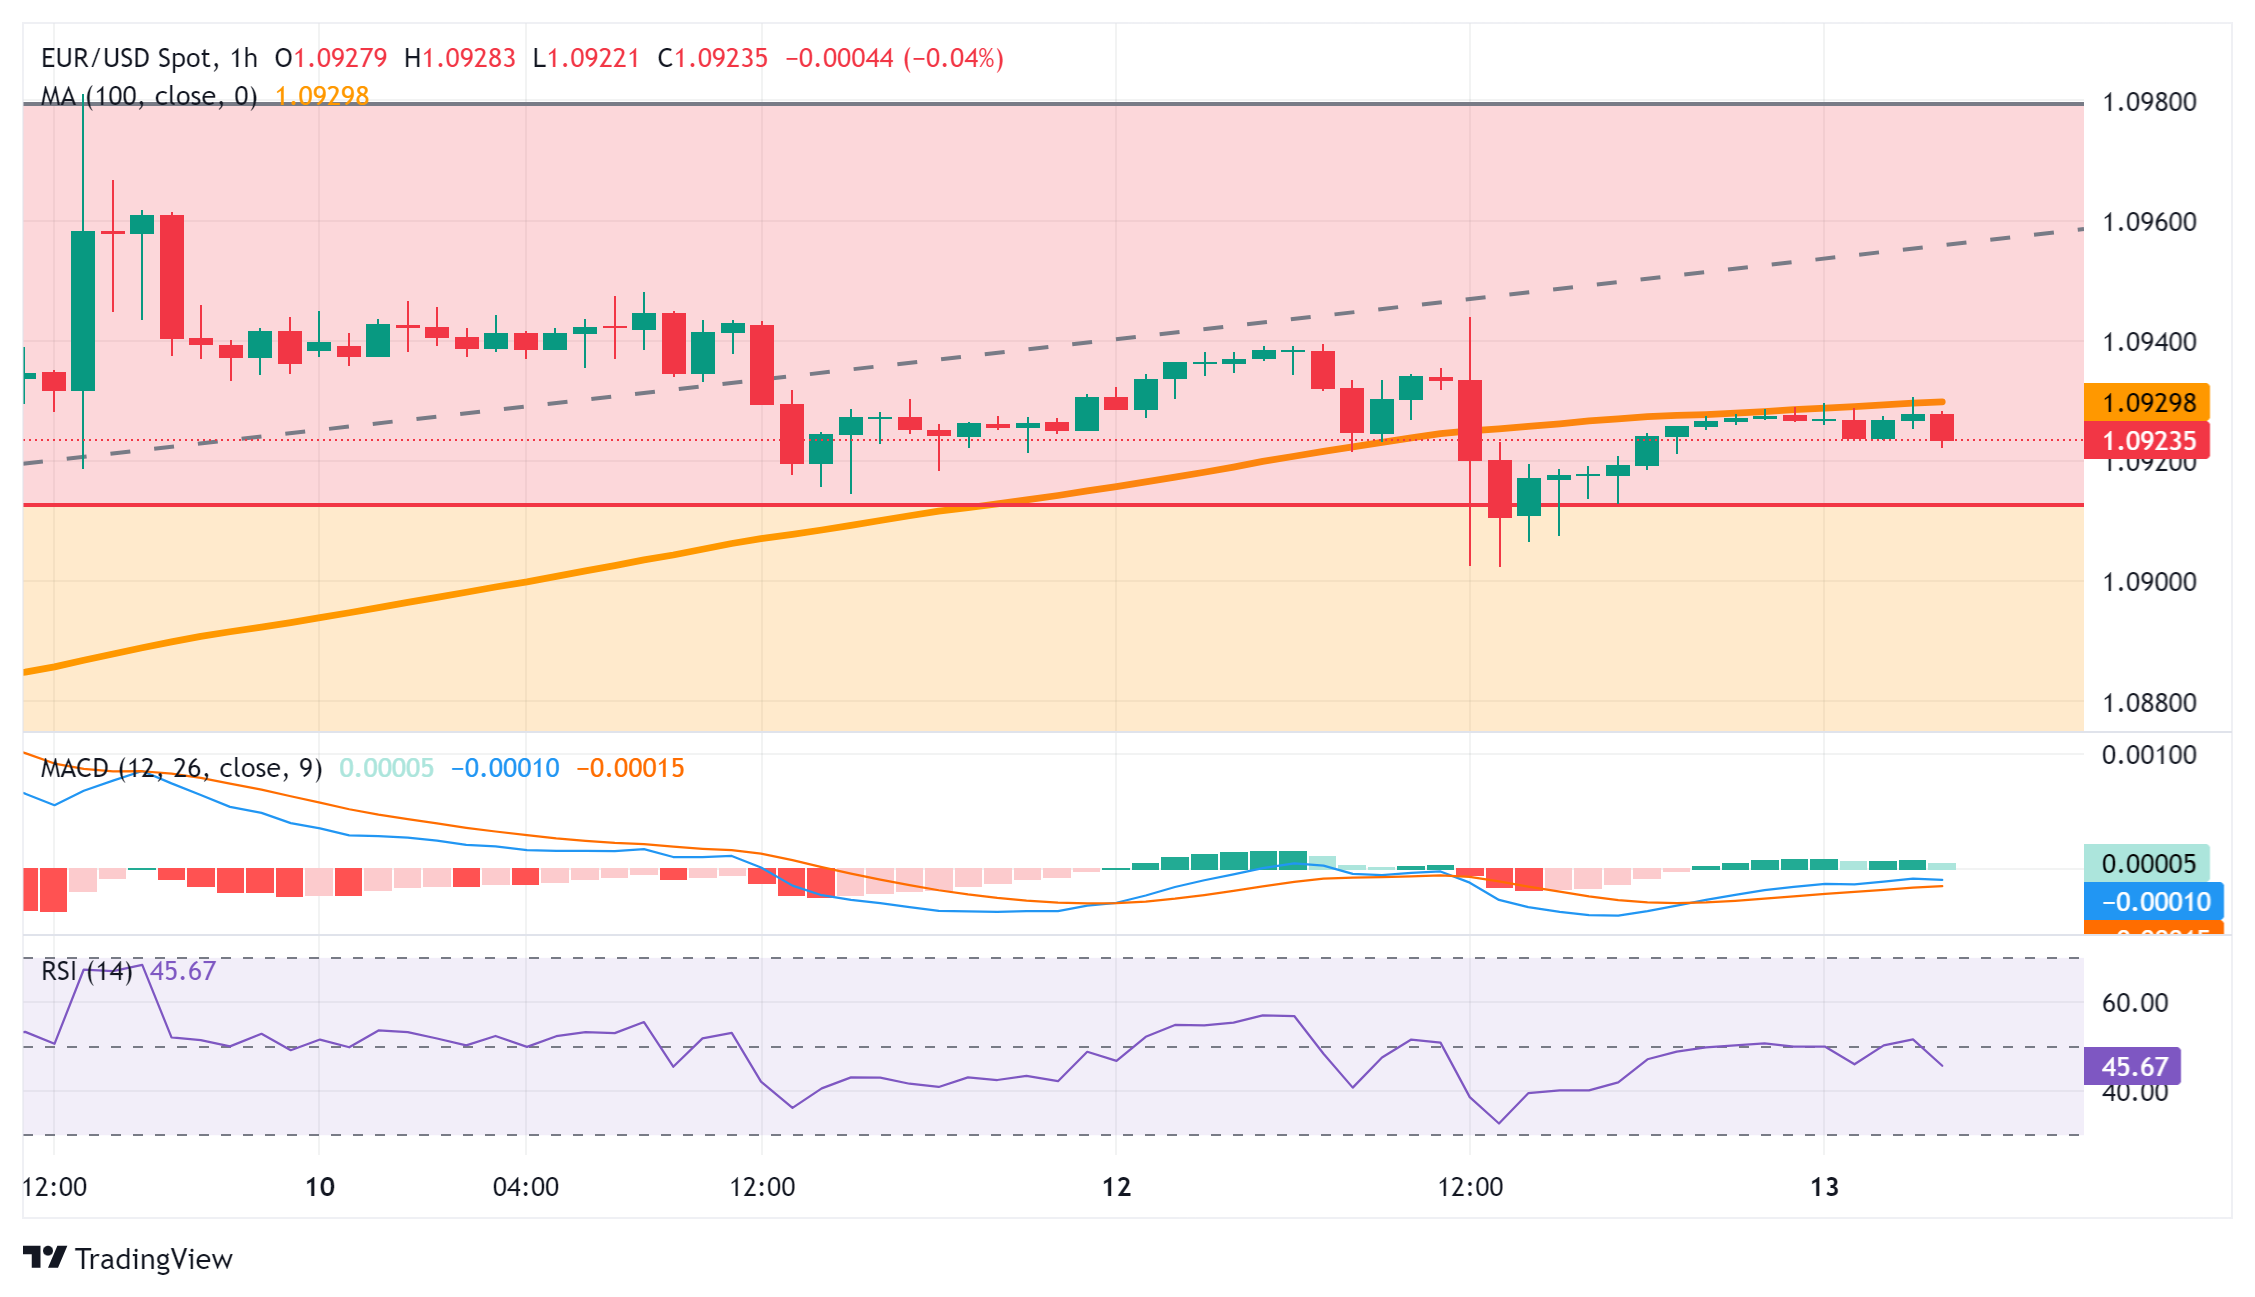
The EUR/USD pair continues with its struggle to gain any meaningful traction on Wednesday and oscillates in a narrow trading band below the 100-hour Simple Moving Average (SMA) during the Asian session. Spot prices currently trade around the 1.0925 area, unchanged for the day as traders await more cues about the Federal Reserve’s (Fed) rate-cut path before positioning for a firm near-term direction.
The US consumer inflation for February came in a bit warmer than expected and fuelled speculations that the Fed may delay interest rate cuts, which, in turn, is seen acting as a tailwind for the US Dollar (USD). In contrast, the European Central Bank (ECB) officials overwhelmingly back the case for the first rate cut in June and have also floated the idea of a further move in July. This undermines the shared currency and further contributes to capping the upside for the EUR/USD pair.
Meanwhile, the markets are still pricing in a greater chance that the US central bank will start cutting interest rates in June. This is reinforced by a fresh leg down in the US Treasury bond yields, which, along with the prevalent risk-on environment, holds back traders from placing aggressive bullish bets around the safe-haven buck and lends some support to the EUR/USD pair. Hence, it will be prudent to wait for strong follow-through selling before positioning for any further decline.
From a technical perspective, spot prices showed some resilience below the 23.6% Fibonacci retracement level of the February-March rally and for now, seem to have stalled the recent pullback from the 1.0980 area, or a near two-month high touched last week. Moreover, oscillators on the daily chart are holding in the positive territory and are still away from being in the overbought zone, which favours the EUR/USD bulls. The lack of any meaningful buying, however, warrants some caution.
In the meantime, the overnight swing low, around the 1.0900 round-figure mark, is likely to protect the immediate downside ahead of the 1.0870 area, or the 38.2% Fibo. A convincing breakthrough might expose the 50% Fibo. level, around the 1.0840-1.0835 region, below which the EUR/USD pair could turn vulnerable and accelerate the downfall further towards testing sub-1.0800 levels, or the monthly through.
On the flip side, the 1.0945-1.0950 zone could act as an immediate hurdle ahead of the 1.0980 region, or the monthly peak, and the 1.1000 psychological mark. A sustained strength beyond the latter will be seen as a fresh trigger for bullish traders and set the stage for an extension of the recent goodish recovery from sub-1.0700 levels, or the YTD low touched on February 15. The EUR/USD pair might then climb to the 1.1045-1.1050 intermediate resistance en route to the 1.1100 round figure.
EUR/USD 1-hour chart
Author

Haresh Menghani
FXStreet
Haresh Menghani is a detail-oriented professional with 10+ years of extensive experience in analysing the global financial markets.