|

EUR/USD Price Analysis: Retreats from the weekly high to near 1.0770

  • EUR/USD could approach the major support at 1.0750 following February’s low at 1.0694.
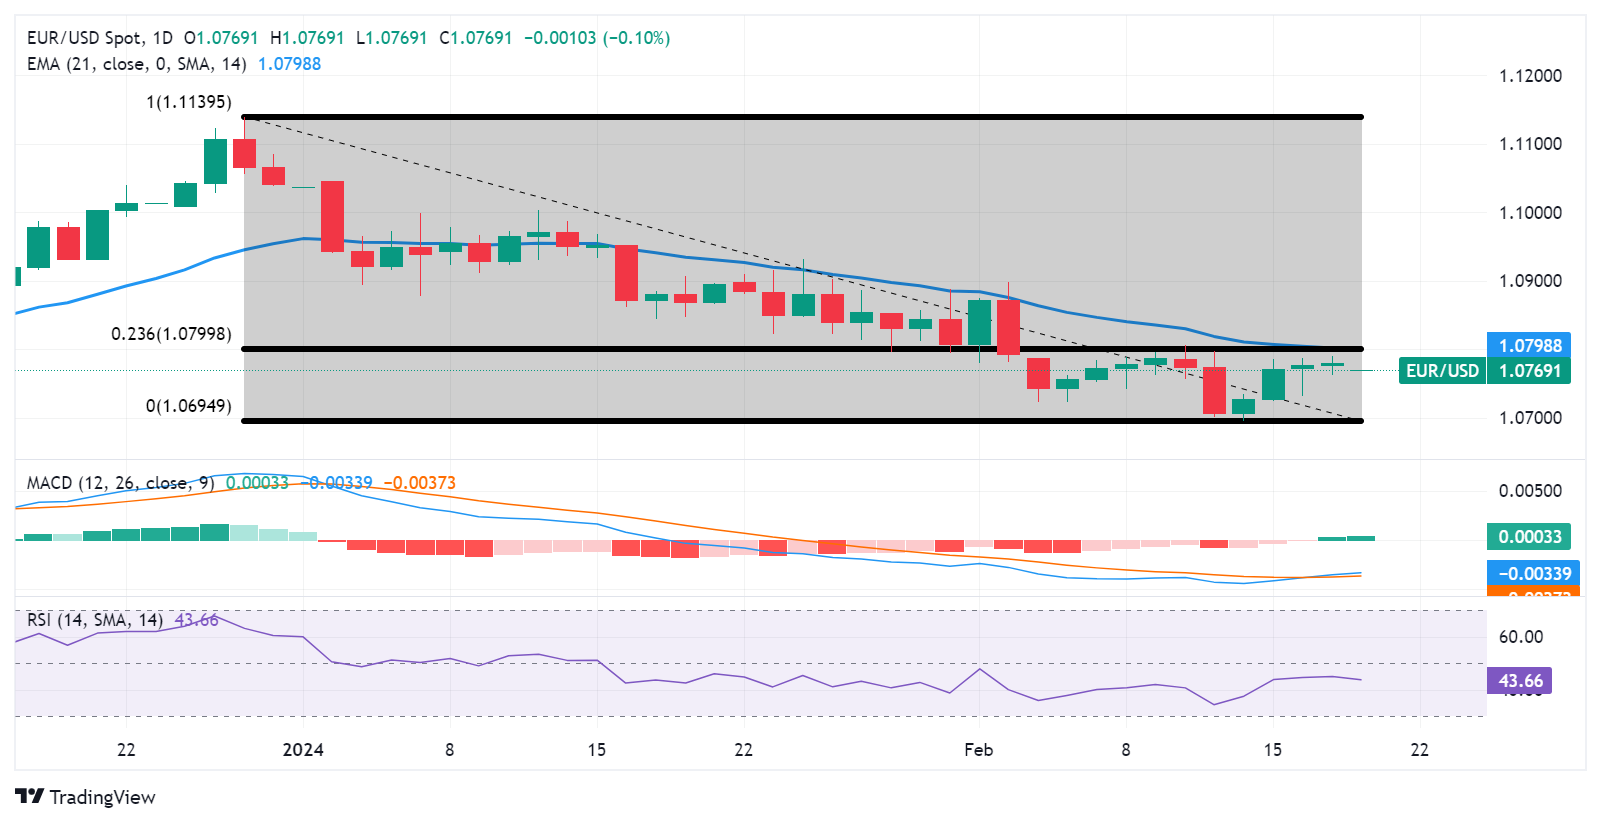
  • The resistance zone could be found around the 21-day EMA at 1.0798 and the 23.6% Fibonacci retracement at 1.0799.
  • Traders may await the lagging indicator MACD to confirm a directional trend.

EUR/USD retreats from the weekly high of 1.0789, which was recorded on Monday, snapping a four-day winning streak. The pair trades lower around 1.0770 during the Asian hours on Tuesday with positioning above the immediate support at the psychological level of 1.0750.

A break below the latter could put weight on the EUR/USD pair to navigate the further support region around the psychological level of 1.0700, in conjunction with February’s low at 1.0694, which was observed on February 14.

The EUR/USD pair could find the key resistance zone around the 21-day Exponential Moving Average (EMA) at 1.0798 lined up with the 23.6% Fibonacci retracement at 1.0799 and the psychological level of 1.0800.

A firm breakthrough above the resistance zone could exert upward support on the EUR/USD pair to explore the further major barrier at 1.0850, to revisit February’s high at 1.0897 aligned with the psychological level of 1.0900.

The technical analysis of the EUR/USD pair suggests a mixed outlook in the market. The 14-day Relative Strength Index (RSI) is below the 50 mark, indicating a bearish momentum. However, the lagging indicator Moving Average Convergence Divergence (MACD), although still below the centerline, is above the signal line, suggesting a tepid momentum in the market.

Given these conflicting signals, market participants may choose to await further confirmation from the MACD indicator on the directional trend for the EUR/USD pair.

EUR/USD: Daily Chart

EUR/USD: other technical levels to watch

Overview
Today last price1.0768
Today Daily Change-0.0011
Today Daily Change %-0.10
Today daily open1.0779
 
Trends
Daily SMA201.0797
Daily SMA501.0891
Daily SMA1001.08
Daily SMA2001.0827
 
Levels
Previous Daily High1.079
Previous Daily Low1.0762
Previous Weekly High1.0806
Previous Weekly Low1.0695
Previous Monthly High1.1046
Previous Monthly Low1.0795
Daily Fibonacci 38.2%1.0779
Daily Fibonacci 61.8%1.0773
Daily Pivot Point S11.0765
Daily Pivot Point S21.075
Daily Pivot Point S31.0737
Daily Pivot Point R11.0792
Daily Pivot Point R21.0804
Daily Pivot Point R31.0819

Author

Akhtar Faruqui

Akhtar Faruqui is a Forex Analyst based in New Delhi, India. With a keen eye for market trends and a passion for dissecting complex financial dynamics, he is dedicated to delivering accurate and insightful Forex news and analysis.

More from Akhtar Faruqui
Share:

Markets move fast. We move first.

Orange Juice Newsletter brings you expert driven insights - not headlines. Every day on your inbox.

By subscribing you agree to our Terms and conditions.

Editor's Picks

EUR/USD stays defensive below 1.1750 as USD finds its feet

EUR/USD kicks off the new week on a softer note, holding below 1.1750 in European trading on Monday. The pair faces challenges due to a pause in the US Dollar downtrend, with traders shifting their focus to the delayed US Nonfarm Payrolls and CPI data for fresh directives. The ECB policy decision is also eagerly awaited. 

GBP/USD holds steady above 1.3350 as traders await key data and BoE

GBP/USD remains on the back foot above 1.3350 in the European session on Monday, though it lacks bearish conviction and holds above the key 200-day SMA support. The US Dollar holds its recovery mode ahead of key data releases, while the Pound Sterling faces headwinds from the expected BoE rate cut this week. 

Gold climbs to seven-week highs on Fed rate cut bets, safe-haven demand

Gold price rises to seven-week highs to near $4,350 during the early European trading hours on Monday. The precious metal extends its upside amid the prospect of interest rate cuts by the US Fed next year. Lower interest rates could reduce the opportunity cost of holding Gold, supporting the non-yielding precious metal.

Solana consolidates as spot ETF inflows near $1 billion signal institutional dip-buying

Solana price hovers above $131 at the time of writing on Monday, nearing the upper boundary of a falling wedge pattern, awaiting a decisive breakout. On the institutional side, demand for spot Solana Exchange-Traded Funds remained firm, pushing total assets under management to nearly $1 billion since launch. 

Big week ends with big doubts

The S&P 500 continued to push higher yesterday as the US 2-year yield wavered around the 3.50% mark following a Federal Reserve (Fed) rate cut earlier this week that was ultimately perceived as not that hawkish after all. The cut is especially boosting the non-tech pockets of the market.

Solana Price Forecast: SOL consolidates as spot ETF inflows near $1 billion signal institutional dip-buying

Solana (SOL) price hovers above $131 at the time of writing on Monday, nearing the upper boundary of a falling wedge pattern, awaiting a decisive breakout.