EUR/USD Price Analysis: Friday’s Doji probes bears near 1.1450


  • EUR/USD fades bounce off 16-month low, struggles to justify bullish candlestick formation.
  • Oversold RSI conditions, multiple supports challenge further downside.
  • Previous support line from October, 10-DMA will test corrective pullback.

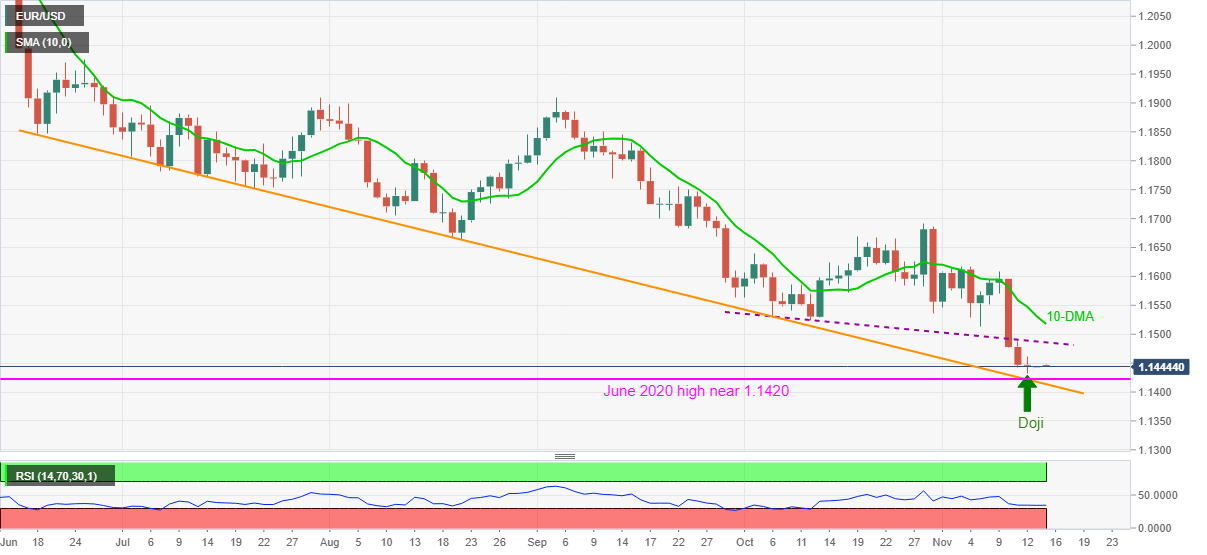
EUR/USD remains pressured around the lowest level since July 2020, lackluster near 1.1445 during Monday’s initial Asian session. In doing so, the major currency pair struggles to justify the previous day’s Doji candlestick formation suggesting a corrective pullback.

Even so, nearly oversold RSI conditions and multiple supports to the downside keep EUR/USD buyers hopeful to challenge the support-turned-resistance line from October, near 1.1485.

Should the quote’s anticipated rebound crosses the 1.1485 hurdle, the 10-DMA figure of 1.1517 will test the pair buyers ahead of directing them to the monthly high near 1.1620.

It’s worth noting that the EUR/USD bulls will remain doubtful until witnessing a clear break of October’s high around 1.1695.

Meanwhile, the further downside will aim for the previous day’s low of 1.1432, a break of which will direct EUR/USD towards the June 2020 top, surrounding 1.1422.

In a case where the pair remains weak past 1.1422, a descending support line from June, near 1.1410 and the 1.1400 threshold will be in the spotlight.

To sum up, EUR/USD bears seem to be tired and Friday’s Doji may trigger the much-awaited rebound considering RSI conditions. However, multiple hurdles do challenge the bull’s entry.

EUR/USD: Daily chart

Trend: Corrective pullback expected

Additional important levels

Overview
Today last price 1.1444
Today Daily Change -0.0002
Today Daily Change % -0.02%
Today daily open 1.1446
 
Trends
Daily SMA20 1.1584
Daily SMA50 1.1646
Daily SMA100 1.1726
Daily SMA200 1.1878
 
Levels
Previous Daily High 1.1462
Previous Daily Low 1.1433
Previous Weekly High 1.1609
Previous Weekly Low 1.1433
Previous Monthly High 1.1692
Previous Monthly Low 1.1524
Daily Fibonacci 38.2% 1.1444
Daily Fibonacci 61.8% 1.1451
Daily Pivot Point S1 1.1432
Daily Pivot Point S2 1.1418
Daily Pivot Point S3 1.1403
Daily Pivot Point R1 1.1461
Daily Pivot Point R2 1.1476
Daily Pivot Point R3 1.1491


Share: Feed news

Information on these pages contains forward-looking statements that involve risks and uncertainties. Markets and instruments profiled on this page are for informational purposes only and should not in any way come across as a recommendation to buy or sell in these assets. You should do your own thorough research before making any investment decisions. FXStreet does not in any way guarantee that this information is free from mistakes, errors, or material misstatements. It also does not guarantee that this information is of a timely nature. Investing in Open Markets involves a great deal of risk, including the loss of all or a portion of your investment, as well as emotional distress. All risks, losses and costs associated with investing, including total loss of principal, are your responsibility. The views and opinions expressed in this article are those of the authors and do not necessarily reflect the official policy or position of FXStreet nor its advertisers. The author will not be held responsible for information that is found at the end of links posted on this page.

If not otherwise explicitly mentioned in the body of the article, at the time of writing, the author has no position in any stock mentioned in this article and no business relationship with any company mentioned. The author has not received compensation for writing this article, other than from FXStreet.

FXStreet and the author do not provide personalized recommendations. The author makes no representations as to the accuracy, completeness, or suitability of this information. FXStreet and the author will not be liable for any errors, omissions or any losses, injuries or damages arising from this information and its display or use. Errors and omissions excepted.

The author and FXStreet are not registered investment advisors and nothing in this article is intended to be investment advice.

Recommended content


Recommended content

Editors’ Picks

AUD/USD recovers to near 0.6450, shrugs off mixed Australian jobs data

AUD/USD recovers to near 0.6450, shrugs off mixed Australian jobs data

AUD/USD is rebounding to near 0.6450 amid renewed US Dollar weakness in the Asian session on Thursday. The pair reverses mixed Australian employment data-led minor losses, as risk sentiment recovers. 

AUD/USD News

USD/JPY bounces back toward 154.50 amid risk-recovery

USD/JPY bounces back toward 154.50 amid risk-recovery

USD/JPY bounces back toward 154.50 in Asian trading on Thursday, having tested 154.00 on the latest US Dollar pullback and Japan's FX intervention risks. A recovery in risk appetite is aiding the rebound in the pair. 

USD/JPY News

Gold rebounds on market caution, aims to reach $2,400

Gold rebounds on market caution, aims to reach $2,400

Gold price recovers its recent losses, trading around $2,370 per troy ounce during the Asian session on Thursday. The safe-haven yellow metal gains ground as traders exercise caution amidst heightened geopolitical tensions in the Middle East.

Gold News

Manta Network price braces for volatility as $44 million worth of MANTA is due to flood markets

Manta Network price braces for volatility as $44 million worth of MANTA is due to flood markets

Manta Network price was not spared from the broader market crash instigated by a weakness in the Bitcoin market. While analysts call a bottoming out in the BTC price, the Web3 modular ecosystem token could suffer further impact.

Read more

Investors hunkering down

Investors hunkering down

Amidst a relentless cautionary deluge of commentary from global financial leaders gathered at the International Monetary Fund and World Bank Spring meetings in Washington, investors appear to be taking a hiatus after witnessing significant market movements in recent weeks.

Read more

Forex MAJORS

Cryptocurrencies

Signatures