|

EUR/USD Price Analysis: Floats above 1.0580 support

  • EUR/USD remains sidelined around three-week-old horizontal support, fades upside momentum of late.
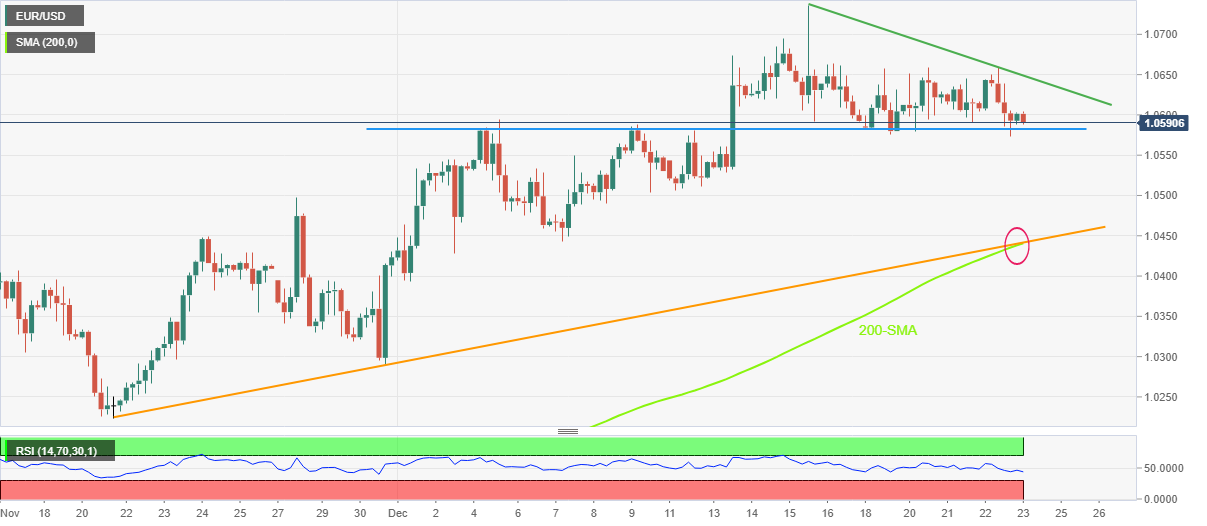
  • Downbeat RSI keeps bears hopeful of meeting 1.0440 support confluence.
  • Bulls need to cross the weekly resistance line to retake control.

EUR/USD fades late Thursday’s corrective bounce off short-term key support as it retreats to 1.0590 during Friday’s Asian session.

Not only the failure to stay beyond the short-term key support but the RSI (14) line also keeps the pair sellers hopeful by printing the sub-50 level but staying beyond the oversold region.

As a result, the quote is likely to break the aforementioned three-week-old horizontal support line, close to 1.0580.

Following that, a slump toward the previous weekly low near the 1.0500 round figure becomes imminent.

However, a convergence of the 200-SMA and a one-month-long ascending trend line, close to 1.0440, appears a tough nut to crack for the EUR/USD bears afterward.

In a case where the pair sellers manage to keep the reins past 1.0440, the late November swing low near 1.0220 will gain the market’s attention.

On the flip side, a one-week-old descending resistance line, close to 1.0650, guards the EUR/USD pair’s immediate recovery moves.

Also acting as upside filters are multiple hurdles around 1.0660 and 1.0700, a break of which could challenge the monthly high of 1.0736.

To sum up, EUR/USD holds onto the bearish bias despite the latest inaction around the short-term key support.

EUR/USD: Four-hour chart

Trend: Further downside expected

Additional important levels

Overview
Today last price1.06
Today Daily Change0.0002
Today Daily Change %0.02%
Today daily open1.0598
 
Trends
Daily SMA201.0529
Daily SMA501.0247
Daily SMA1001.0102
Daily SMA2001.0337
 
Levels
Previous Daily High1.0659
Previous Daily Low1.0573
Previous Weekly High1.0736
Previous Weekly Low1.0506
Previous Monthly High1.0497
Previous Monthly Low0.973
Daily Fibonacci 38.2%1.0606
Daily Fibonacci 61.8%1.0626
Daily Pivot Point S11.0561
Daily Pivot Point S21.0524
Daily Pivot Point S31.0475
Daily Pivot Point R11.0647
Daily Pivot Point R21.0696
Daily Pivot Point R31.0733

Author

Anil Panchal

Anil Panchal

FXStreet

Anil Panchal has nearly 15 years of experience in tracking financial markets. With a keen interest in macroeconomics, Anil aptly tracks global news/updates and stays well-informed about the global financial moves and their implications.

More from Anil Panchal
Share:

Editor's Picks

AUD/USD falls to near 0.7100 after slipping below 50-day EMA

AUD/USD depreciates after registering minor gains in the previous day, trading around 0.7120 during the Asian hours. The technical analysis of the daily chart shows the pair consolidating sideways within a rectangle pattern, as neither bulls nor bears gain control. The AUD/USD pair is holding a slight bearish tone however as it sits beneath both the nine-day and 50-day EMAs.

160.00: USD/JPY back near intervention territory after upbeat US jobs report

US Nonfarm Payrolls beat expectations by a wide margin in May, with 172K jobs added. The US Dollar rebounds after the release, helping USD/JPY recover from its intraday lows. Warnings from Japanese authorities continue to limit upside potential near the 160.00 threshold.

Gold targets $4,300 amid stronger Dollar

Gold faces increasing selling interest and navigates the area of three-month lows near the $4,300 mark per troy ounce on Friday. The precious metal’s decline comes as traders assess the stronger-than-expected NFP, while the bid bias in the Greenback and higher US Treasury yields also collaborate with the retracement.

Cardano hits five-year low even as Hoskinson clarifies "break" isn't an exit

Cardano (ADA) price is down 10% at press time on Friday, extending losses over 30% so far this week amid Charles Hoskinson's clarification that "break" isn't an exit.

Week ahead – Fed countdown begins amid US inflation data and geopolitical risks

Fed Chair Warsh’s first meeting approaches as key US inflation data could reshape expectations. Oil prices remain elevated as US-Iran talks continue; tariffs also return to the spotlight. ECB is expected to hike; will it be a one-off move or is July live?

The US economy defies the rules: 100 days into the Oil shock and the recession signal is still missing

More than three months after the start of the Iran war and the resulting disruption to global energy markets, the US economy continues to display remarkable resilience. The conflict has triggered a sharp rise in Oil prices, reignited inflationary pressures and fueled widespread concerns about a potential economic slowdown.