|

EUR/USD Price Analysis: Downside bias remains intact, 1.1250 likely at risk

  • EUR/USD looks south, with 1.1250 at risks amid firmer USD, yields.
  • Bearish RSI supports the potential move lower towards 1.1200.
  • 1.1300 is the level to beat for the EUR bulls for any meaningful recovery.

EUR/USD is seeing some fresh selling pressure, as we progress towards the European opening bell this Monday.

The US dollar remains firmer on the session, tracking the rebound in the Treasury yields across the curve.

From a broader perspective, the euro remains undermined against the greenback, courtesy of the divergence in the monetary policy outlooks between the Fed and the ECB.

The Fed is set to hike the interest rates around mid-2022 while the ECB policymakers have repeatedly denied talks of a rate increase any time next year.

Attention, therefore, now remains on this week’s FOMC minutes for clarity on the Fed’s rate hike timings and the central bank’s tapering pace.

Meanwhile, looking at the currency pair on the four-hour chart, the 1.1250 target has been achieved last Friday, with the downside risks still intact.

At the time of writing, the spot is trading at 1.1268, down 0.16% on the day. If the strong support around 1.1250, the confluence of Friday’s low and the falling trendline, gets breached, then a test of the 1.1200 psychological level will be inevitable.

The Relative Strength Index (RSI) is holding the lower ground just above the oversold territory, suggesting that there is more room to the downside.

EUR/USD: Four-hour chart

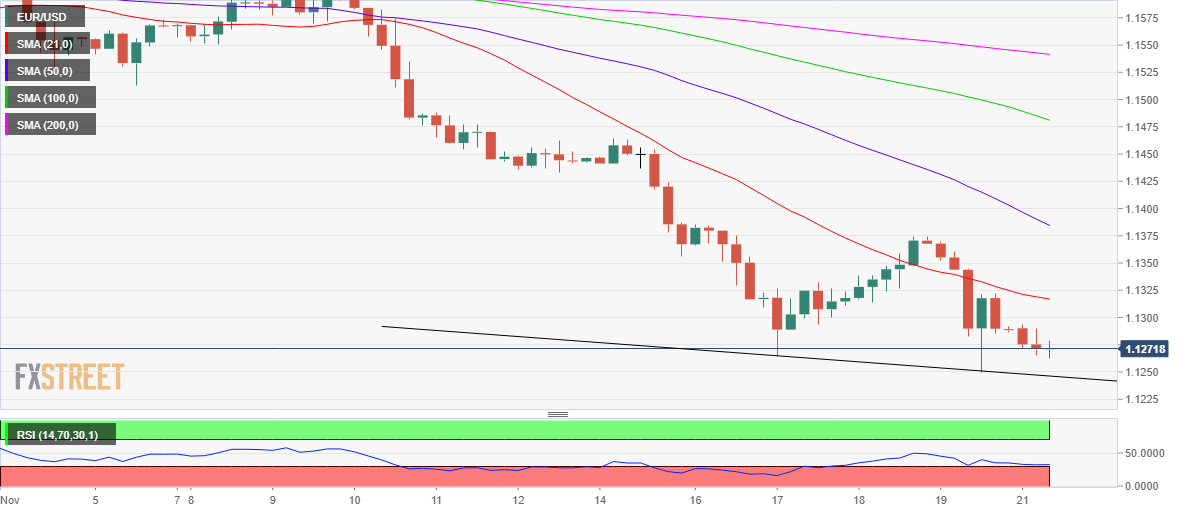
On the flip side, any meaningful recovery will gain traction on recapturing the 1.1300 level.

The next critical upside barrier is seen at the bearish 21-Simple Moving Average (SMA) at 1.1317.

Further up, the 1.1350 psychological barrier will come into play.

EUR/USD: Additional levels to consider

EUR/USD

Overview
Today last price1.1268
Today Daily Change-0.0018
Today Daily Change %-0.16
Today daily open1.1288
 
Trends
Daily SMA201.1509
Daily SMA501.1596
Daily SMA1001.1699
Daily SMA2001.1859
 
Levels
Previous Daily High1.1374
Previous Daily Low1.125
Previous Weekly High1.1464
Previous Weekly Low1.125
Previous Monthly High1.1692
Previous Monthly Low1.1524
Daily Fibonacci 38.2%1.1297
Daily Fibonacci 61.8%1.1327
Daily Pivot Point S11.1234
Daily Pivot Point S21.118
Daily Pivot Point S31.111
Daily Pivot Point R11.1358
Daily Pivot Point R21.1428
Daily Pivot Point R31.1482

Author

Dhwani Mehta

Dhwani Mehta

FXStreet

Residing in Mumbai (India), Dhwani is a Senior Analyst and Manager of the Asian session at FXStreet. She has over 10 years of experience in analyzing and covering the global financial markets, with specialization in Forex and commodities markets.

More from Dhwani Mehta
Share:

Markets move fast. We move first.

Orange Juice Newsletter brings you expert driven insights - not headlines. Every day on your inbox.

By subscribing you agree to our Terms and conditions.

Editor's Picks

EUR/USD remains below 1.1700 amid weakening momentum

EUR/USD remains steady after four days of losses, trading around 1.1680 during the Asian hours on Thursday. On the daily chart, the 14-day Relative Strength Index at 42.6 (neutral-bearish) indicates weakening momentum after slipping below the 50 midline. RSI staying sub-50 would keep bears engaged and limit recovery attempts.

GBP/USD consolidates above mid-1.3400s; bullish potential seems intact

The GBP/USD pair is seen consolidating its heavy losses registered over the past two days and oscillating in a narrow trading band, just above mid-1.3400s during the Asian session on Thursday. However, the fundamental backdrop warrants some caution for bearish traders and before positioning for an extension of the retracement slide from the 1.3565-1.3570 region, or the highest level since September 18, touched on Tuesday.

Gold: Deeper correction or dip-buying likely?

Gold is nursing losses near $4,450 in Asian trading on Thursday, having suffered about a 1% correction from weekly highs of $4,500 on Wednesday. All eyes remain on the geopolitical developments and the incoming US jobless claims data for fresh trading directives.

Top Crypto Losers: Pump.fun, Story, and Pudgy Penguins test key support levels

Pump.fun, Story, and Pudgy Penguins experience intense selling pressure over the last 24 hours. PUMP and IP failed to cross the 50-day Exponential Moving Average, resulting in a pullback on Wednesday, while PENGU is testing its 50-day EMA.

2026 economic outlook: Clear skies but don’t unfasten your seatbelts yet

Most years fade into the background as soon as a new one starts. Not 2025: a year of epochal shifts, in which the macroeconomy was the dog that did not bark. What to expect in 2026? The shocks of 2025 will not be undone, but neither will they be repeated.

XRP battles selling pressure as profit-taking, ETF inflows shape outlook

Ripple (XRP) is trading downward but holding support at $2.22 at the time of writing on Wednesday, as fear spreads across the cryptocurrency market, reversing gains made from the start of the year.