|

EUR/USD Price Analysis: Looks south towards 1.1250 amid a potential bear flag

  • EUR/USD resumes declines towards 16-month lows of 1.1264.
  • Bear flag spotted on the 4H chart, awaits confirmation for further downside.
  • RSI has recovered from the oversold region, backs the negative bias.

EUR/USD is testing daily lows above 1.1300, having faltered its recovery from 16-month lows of 1.1264, as the recovery in the Treasury yields is lifting the demand for the greenback across the board.

The tepid market mood, in the face of persisting inflation concerns and global economic prospects, dent the sentiment around the euro while lending some support to the safe-haven US dollar.

Meanwhile, the dovish comments from the European Central Bank (ECB) policymakers continue to remain a weight on the euro, as it brings the monetary policy divergence between the Fed and the ECB back to the fore.

Attention now turns towards the ECB-speak and the US weekly Jobless Claims data for fresh trading impetus on the major.

From a short-term technical perspective, the recent sell-off that followed a brief recovery stint carved out a bear flag formation on the four-hour chart.

A four-hourly candlestick closing below the rising trendline support at 1.1308 will confirm the bearish continuation pattern, opening floors for a retest of the yearly lows.

A breach of the latter will accelerate the downside towards 1.1200.

The Relative Strength Index (RSI) has recovered from the oversold territory but remains well below the midline, suggesting that there is room for another leg lower.

EUR/USD: Four-hour chart

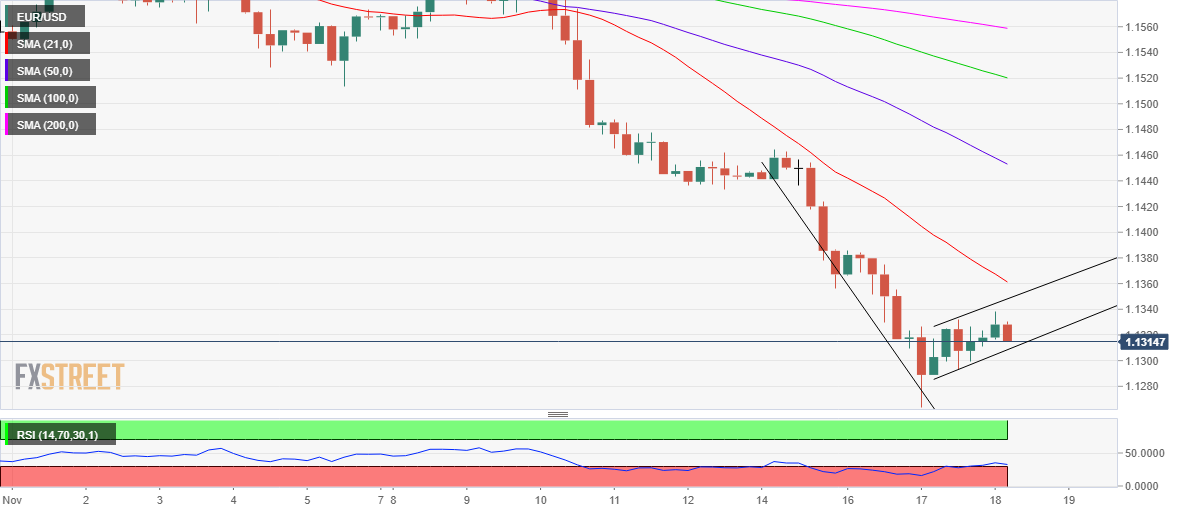
On the flip side, the recovery will gain momentum only on a firm break above the rising trendline resistance at 1.1348.

The next critical upside barrier is seen at the bearish 21-Simple Moving Average (SMA) at 1.1361.

Recapturing 21-SMA is critical to negate the bearish bias in the near term.

EUR/USD: Additional levels to consider

EUR/USD

Overview
Today last price1.1317
Today Daily Change-0.0003
Today Daily Change %-0.03
Today daily open1.1322
 
Trends
Daily SMA201.1539
Daily SMA501.1615
Daily SMA1001.1709
Daily SMA2001.1867
 
Levels
Previous Daily High1.1332
Previous Daily Low1.1264
Previous Weekly High1.1609
Previous Weekly Low1.1433
Previous Monthly High1.1692
Previous Monthly Low1.1524
Daily Fibonacci 38.2%1.1306
Daily Fibonacci 61.8%1.129
Daily Pivot Point S11.128
Daily Pivot Point S21.1238
Daily Pivot Point S31.1212
Daily Pivot Point R11.1348
Daily Pivot Point R21.1374
Daily Pivot Point R31.1417

Author

Dhwani Mehta

Dhwani Mehta

FXStreet

Residing in Mumbai (India), Dhwani is a Senior Analyst and Manager of the Asian session at FXStreet. She has over 10 years of experience in analyzing and covering the global financial markets, with specialization in Forex and commodities markets.

More from Dhwani Mehta
Share:

Editor's Picks

EUR/USD stays near 1.1650 with fading momentum

EUR/USD holds ground after five days of losses, trading around 1.1650 during the Asian hours on Friday. The 14-day Relative Strength Index momentum indicator at 39 trends lower, confirming fading momentum rather than oversold conditions.

GBP/USD remains below 1.3450, nine-day EMA

GBP/USD remains subdued for the fourth consecutive day, trading around 1.3430 during the Asian hours on Friday. The momentum indicator 14-day Relative Strength Index at 51.9 is neutral, reflecting slower momentum after firm recent readings. An RSI drop back beneath 50 would strengthen the case for a deeper pullback.

Gold edges lower as USD preserves its recent gains ahead of US NFP report

Gold struggles to capitalize on the previous day's goodish rebound from the vicinity of the $4,400 mark and attracts fresh sellers during the Asian session on Friday. The US Dollar preserves its gains registered over the past two weeks and touches a nearly one-month high, undermining the commodity. 

Bitcoin, Ethereum and Ripple find key support, reviving rally hopes

Bitcoin, Ethereum, and Ripple steadied above key support levels on Friday after being rejected at mid-week resistance zones. The short-term recovery prospects remain intact if the top three cryptocurrencies by market capitalization hold these support zones.

2026 economic outlook: Clear skies but don’t unfasten your seatbelts yet

Most years fade into the background as soon as a new one starts. Not 2025: a year of epochal shifts, in which the macroeconomy was the dog that did not bark. What to expect in 2026? The shocks of 2025 will not be undone, but neither will they be repeated.

Pepe Price Forecast: PEPE risks 100-day EMA fallout as bullish interest fades

Pepe is under extreme selling pressure, trading in the red for the fifth consecutive day, down 1% at press time on Friday. Pepe’s decline following a 72% hike last week suggests a likely profit-booking phase, while on-chain data indicates declining network activity.