|

EUR/USD Price Analysis: Double bottom around 1.0760 keeps Euro buyers hopeful

  • EUR/USD picks up bids to consolidate recent losses, forms bullish chart pattern.
  • Convergence of 50-HMA, 100-HMA and fortnight-long resistance line appears a tough nut to crack for Euro buyers.
  • Sellers can aim for late March swing lows on 1.0760 breakdown.
  • ECB’s Lagarde, Fed Minutes eyed for clear directions.

EUR/USD glides on a dicey floor with mild gains around 1.0775 as it waits for the key catalysts on early Wednesday in Europe. In doing so, the Euro pair forms a bullish chart pattern called the “Double Bottom” with eyes on a speech from European Central Bank (ECB) President Christine Lagarde and Minutes of the latest Federal Open Market Committee (FOMC) Monetary Policy Meeting.

Also read: EUR/USD dribbles below 1.0800 amid lackluster US debt ceiling talks, focus on ECB’s Lagarde, Fed Minutes

Not only the “Double Bottom” formation but the recent improvements in the RSI (14) line from the oversold territory and the bullish MACD signals also underpin the hopes of the EUR/USD pair’s further recovery.

However, the 100-Hour Moving Average (HMA) joins the 50-HMA and a downward-sloping trend line from early May to constitute the 1.0800 as the key upside hurdle for the Euro buyers to cross to retake control.

Following that, a quick run-up towards the 200-HMA and mid-May low, respectively near 1.0835 and 1.0845 can’t be ruled out.

On the contrary, EUR/USD pullback remains elusive unless the quote stays beyond the “Double Bottom” of around 1.0760.

Should the Euro bears manage to conquer the 1.0760 key support and defy the bullish chart formation, the pair becomes vulnerable to plunging toward the late March low of near 1.0715.

EUR/USD: Hourly chart
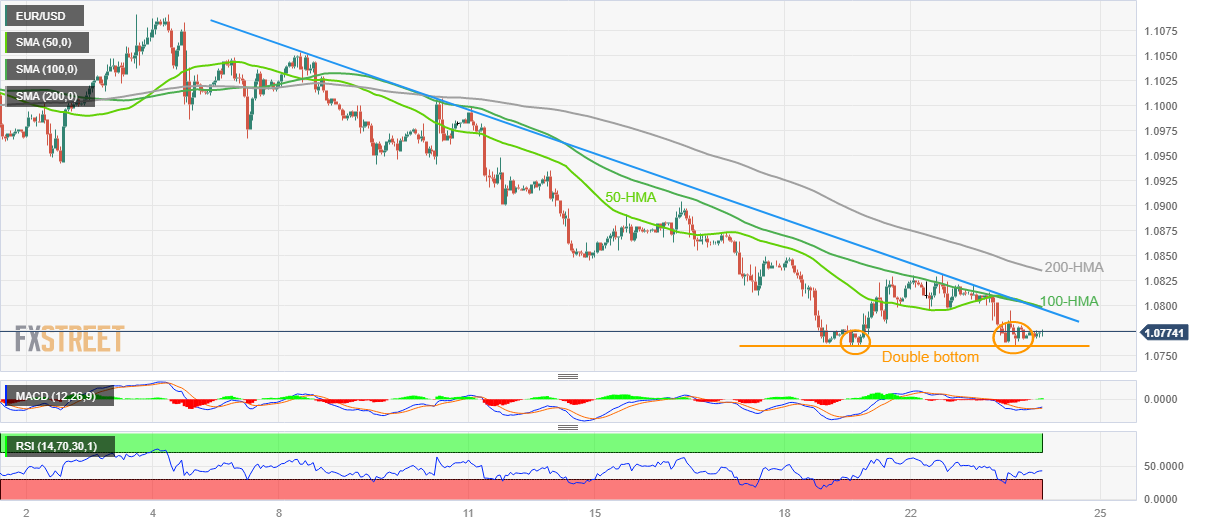
Trend: Limited recovery expected

Additional important levels

Overview
Today last price1.0776
Today Daily Change0.0006
Today Daily Change %0.06%
Today daily open1.077
 
Trends
Daily SMA201.093
Daily SMA501.0897
Daily SMA1001.0812
Daily SMA2001.0473
 
Levels
Previous Daily High1.082
Previous Daily Low1.076
Previous Weekly High1.0904
Previous Weekly Low1.076
Previous Monthly High1.1095
Previous Monthly Low1.0788
Daily Fibonacci 38.2%1.0783
Daily Fibonacci 61.8%1.0798
Daily Pivot Point S11.0747
Daily Pivot Point S21.0723
Daily Pivot Point S31.0687
Daily Pivot Point R11.0807
Daily Pivot Point R21.0844
Daily Pivot Point R31.0867

Author

Anil Panchal

Anil Panchal

FXStreet

Anil Panchal has nearly 15 years of experience in tracking financial markets. With a keen interest in macroeconomics, Anil aptly tracks global news/updates and stays well-informed about the global financial moves and their implications.


More from Anil Panchal
Share:

Editor's Picks

GBP/USD faces daily resistance near 1.3650

GBP/USD resumes its decline, reversing Tuesday’s bullish attempt and failing once again to break above 1.3650. Cable’s decent pullback follows an acceptable advance in the Greenback as investors continue to assess latest US PCE and GDP data.

EUR/USD remains sidelined around 1.1670 post US-PCE

EUR/USD alternates gains with losses around 1.1670 on Wednesday. The pair’s retracement comes on the back of modest gains in the US Dollar in the wake of the release of July PCE data and another revision of Q2 GDP figures.

Gold surrenders some weekly gains; back toward $4,600

Gold now faces some renewed downside pressure and seems to challenge the key $4,600 mark per troy ounce on Tuesday. That said, the yellow metal’s correction comes after three daily upticks in a row, fading at the same time Tuesday’s move to fresh tops around $4,700.

Bitcoin recovery stalls near $80,000 as ETF inflows mount, whale demand strengthens

Bitcoin price is trading in the green on Wednesday, holding above $78,000 while struggling to extend its recovery above the $80,000 mark. Institutional demand is strengthening, with steady inflows and BlackRock’s tax-deferred Bitcoin-to-ETF swap volume reaching $5 billion.

Nvidia: How will the company perform as its switches from a chip maker to an AI finance house?

The main event for markets this week takes place this evening, after US markets close. Nvidia, the AI giant, will report results for last quarter. Another monster report is expected. Revenues could come in above $92bn, and earnings per share could come in at $2.09.

Canada hits US goods with tariffs; The rate market sees a problem
On September 8, Canada begins charging its own importers 15%, 25% and 50% on roughly 700 lines of American goods. The measure is billed as dollar for dollar, and on the arithmetic of covered trade it is. What it is not is a tax on the United States.















