EUR/USD Price Analysis: Bulls struggle below 1.0940 hurdle


  • EUR/USD struggles after six-day uptrend, seesaws near nine-month high.
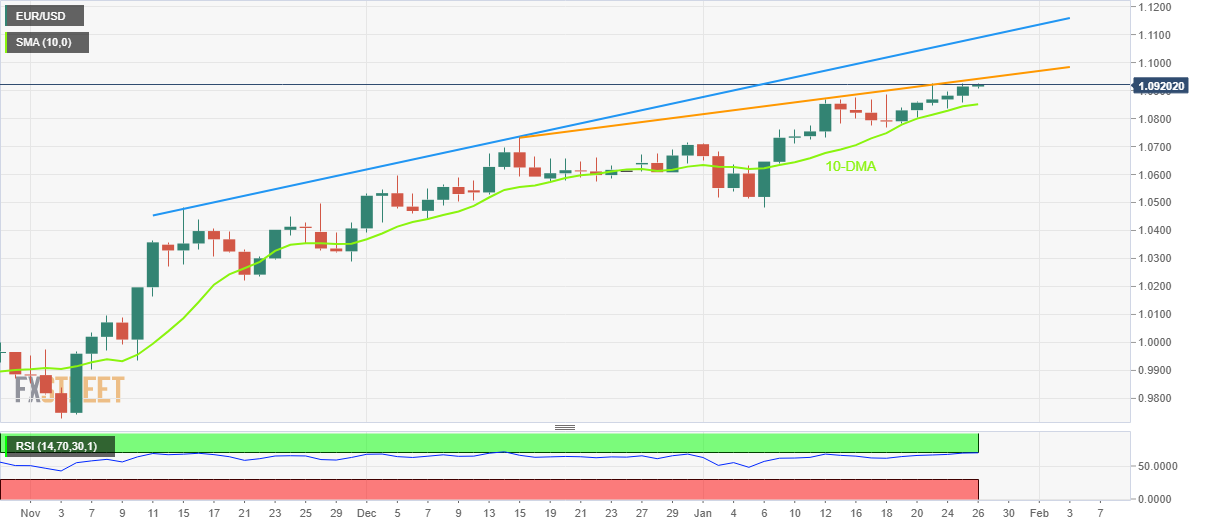
  • Overbought RSI conditions join six-week-old resistance line to challenge further upside.
  • Bears need validation from the 10-DMA to retake control.

EUR/USD bounces off intraday low to around 1.0920 as it consolidates weekly gains, the third one in a row, ahead of the US fourth quarter (Q4) Gross Domestic Product (GDP) on Thursday.

The major currency pair justifies the overbought RSI (14) as it prints the first daily loss in seven days.

Not only the Relative Strength Index (RSI) conditions but the ascending trend line from mid-December, near 1.0940 by the press time, also challenges the EUR/USD buyers.

With this, the pair is likely to decline towards the 10-DMA support, close to 1.0850 at the latest. However, any further downside needs to conquer the previous monthly low surrounding 1.0735 to welcome the EUR/USD bears.

Following that, a downward trajectory towards the monthly low near 1.0485 can’t be ruled out.

Meanwhile, an upside break of the aforementioned six-week-long resistance line, around 1.0940, could quickly propel EUR/USD towards the 1.1000 round figure.

Even so, another ascending trend line resistance, from November 15, 2022, could challenge the EUR/USD buyers afterward around 1.1090. It’s worth mentioning that the top marked during late March of the last year, near 1.1185, could jump on the bull’s radar past 1.1090.

To sum up, EUR/USD bulls are likely to take a breather as traders braces for the key data/events. However, the bears are far from the entry.

EUR/USD: Daily chart

Trend: Limited upside expected

Additional important levels

Overview
Today last price 1.0916
Today Daily Change 0.0002
Today Daily Change % 0.02%
Today daily open 1.0914
 
Trends
Daily SMA20 1.0751
Daily SMA50 1.0603
Daily SMA100 1.026
Daily SMA200 1.0311
 
Levels
Previous Daily High 1.0924
Previous Daily Low 1.0857
Previous Weekly High 1.0888
Previous Weekly Low 1.0766
Previous Monthly High 1.0736
Previous Monthly Low 1.0393
Daily Fibonacci 38.2% 1.0898
Daily Fibonacci 61.8% 1.0883
Daily Pivot Point S1 1.0873
Daily Pivot Point S2 1.0832
Daily Pivot Point S3 1.0807
Daily Pivot Point R1 1.094
Daily Pivot Point R2 1.0965
Daily Pivot Point R3 1.1006


Share: Feed news

Information on these pages contains forward-looking statements that involve risks and uncertainties. Markets and instruments profiled on this page are for informational purposes only and should not in any way come across as a recommendation to buy or sell in these assets. You should do your own thorough research before making any investment decisions. FXStreet does not in any way guarantee that this information is free from mistakes, errors, or material misstatements. It also does not guarantee that this information is of a timely nature. Investing in Open Markets involves a great deal of risk, including the loss of all or a portion of your investment, as well as emotional distress. All risks, losses and costs associated with investing, including total loss of principal, are your responsibility. The views and opinions expressed in this article are those of the authors and do not necessarily reflect the official policy or position of FXStreet nor its advertisers. The author will not be held responsible for information that is found at the end of links posted on this page.

If not otherwise explicitly mentioned in the body of the article, at the time of writing, the author has no position in any stock mentioned in this article and no business relationship with any company mentioned. The author has not received compensation for writing this article, other than from FXStreet.

FXStreet and the author do not provide personalized recommendations. The author makes no representations as to the accuracy, completeness, or suitability of this information. FXStreet and the author will not be liable for any errors, omissions or any losses, injuries or damages arising from this information and its display or use. Errors and omissions excepted.

The author and FXStreet are not registered investment advisors and nothing in this article is intended to be investment advice.

Recommended content


Recommended content

Editors’ Picks

EUR/USD climbs to 10-day highs above 1.0700

EUR/USD climbs to 10-day highs above 1.0700

EUR/USD gained traction and rose to its highest level in over a week above 1.0700 in the American session on Tuesday. The renewed US Dollar weakness following the disappointing PMI data helps the pair stretch higher.

EUR/USD News

GBP/USD extends recovery beyond 1.2400 on broad USD weakness

GBP/USD extends recovery beyond 1.2400 on broad USD weakness

GBP/USD gathered bullish momentum and extended its daily rebound toward 1.2450 in the second half of the day. The US Dollar came under heavy selling pressure after weaker-than-forecast PMI data and fueled the pair's rally. 

GBP/USD News

Gold rebounds to $2,320 as US yields turn south

Gold rebounds to $2,320 as US yields turn south

Gold reversed its direction and rose to the $2,320 area, erasing a large portion of its daily losses in the process. The benchmark 10-year US Treasury bond yield stays in the red below 4.6% following the weak US PMI data and supports XAU/USD.

Gold News

Here’s why Ondo price hit new ATH amid bearish market outlook Premium

Here’s why Ondo price hit new ATH amid bearish market outlook

Ondo price shows no signs of slowing down after setting up an all-time high (ATH) at $1.05 on March 31. This development is likely to be followed by a correction and ATH but not necessarily in that order.

Read more

Germany’s economic come back

Germany’s economic come back

Germany is the sick man of Europe no more. Thanks to its service sector, it now appears that it will exit recession, and the economic future could be bright. The PMI data for April surprised on the upside for Germany, led by the service sector.

Read more

Forex MAJORS

Cryptocurrencies

Signatures