|

EUR/USD Price Analysis: Bearish bias remains intact below 1.0650 hurdle

  • EUR/USD pares the first daily gains in three during sluggish session.
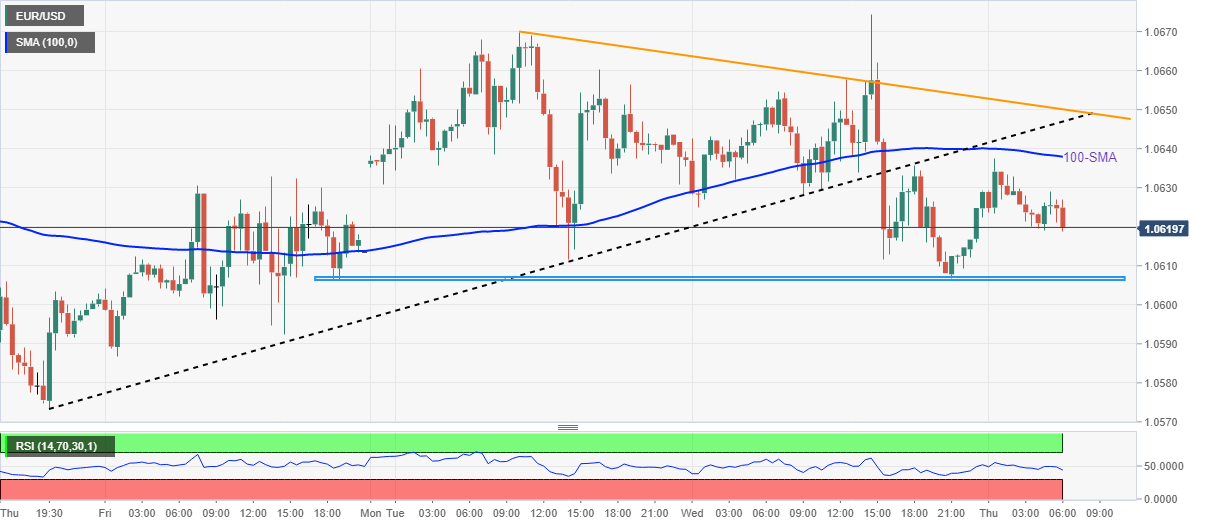
  • Clear downside break of weekly support line, sustained trading below 100-SMA favor sellers.
  • Descending trend line from Tuesday adds to the upside filters.
  • Weekly horizontal support restricts immediate downside amid steady RSI.

EUR/USD takes offers to consolidate the first daily gains in three around 1.0620 heading into Thursday’s European session. Even so, the major currency pair prints 0.13% intraday gains by the press time.

That said, the quote broke a one-week-old ascending trend line, as well as the 100-Simple Moving Average (SMA), the previous day and favored the bears.

The following corrective bounce off the late Friday’s trough, however, failed to cross the aforementioned hurdles and join the steady RSI (14) to keep sellers hopeful.

As a result, EUR/USD bears are likely to revisit the weekly horizontal support zone surrounding 1.0600, a break of which could quickly drag the quote towards the previous weekly low near 1.0575.

It’s worth noting that the pair’s weakness past 1.0575 will highlight the 1.0440 support level, as well as the monthly low of 1.0393 for the EUR/USD sellers.

On the contrary, the 100-SMA level of 1.0640 precedes the previous support line, around 1.0645 at the latest, to restrict the short-term EUR/USD upside.

Following that, a downward-sloping trend line from Tuesday, close to 1.0650 by the press time, will gain the market’s attention.

In a case where the EUR/USD bulls manage to cross the 1.0650 hurdle, which is less expected, the quote is likely to refresh the monthly high, currently around 1.0735.

EUR/USD: 30-minute chart

Trend: Further downside expected

Additional important levels

Overview
Today last price1.0624
Today Daily Change0.0016
Today Daily Change %0.15%
Today daily open1.0608
 
Trends
Daily SMA201.0579
Daily SMA501.0313
Daily SMA1001.0118
Daily SMA2001.0328
 
Levels
Previous Daily High1.0674
Previous Daily Low1.0608
Previous Weekly High1.0659
Previous Weekly Low1.0573
Previous Monthly High1.0497
Previous Monthly Low0.973
Daily Fibonacci 38.2%1.0633
Daily Fibonacci 61.8%1.0649
Daily Pivot Point S11.0586
Daily Pivot Point S21.0564
Daily Pivot Point S31.0519
Daily Pivot Point R11.0652
Daily Pivot Point R21.0697
Daily Pivot Point R31.0719

Author

Anil Panchal

Anil Panchal

FXStreet

Anil Panchal has nearly 15 years of experience in tracking financial markets. With a keen interest in macroeconomics, Anil aptly tracks global news/updates and stays well-informed about the global financial moves and their implications.

More from Anil Panchal
Share:

Editor's Picks

GBP/USD bounces off lows, back above 1.3200

After bottoming out near 1.3160, GBP/USD manages to regain a bit of shine and reclaim the 1.3200 mark and beyond at the end of the week. Stronger-than-expected UK Retail Sales data seem to be helping the British Pound limit its losses, while the chaotic UK political environment keeps the bulls at bay for now.

EUR/USD looks consolidative around 1.1460

EUR/USD stages a modest rebound after slipping to a three-month low below 1.1420 at the end of the week. That said, the pair now looks to consolidate humble gains just above 1.1460 despite growing uncertainty surrounding the next round of US-Iran negotiations, which keeps the US Dollar’s downside contained.

Gold slips back to six-day lows, targets $4,100

Gold retreats for the third consecutive day on Friday, eroding gains seen in the first half of the week and approaching the key $4,100 mark per troy ounce. Indeed, the precious metal continues to face headwinds from the Fed's hawkish stance and renewed uncertainty surrounding the next round of US-Iran negotiations.

Solana extends correction despite ETF inflows, RWA adoption

Solana (SOL) price edges below $70 extending its losses for the fourth straight day this week. The institutional demand for Solana is building, with steady inflows so far this week and Morgan Stanley’s amended S-1 filing for a Solana-focused Exchange-Traded Fund.

The Iran war didn't break the US economy, but what happens next?

Nearly four months after the start of the Iran war, the US economy remains remarkably resilient. While the conflict initially triggered a severe disruption to global energy markets and a sharp rise in Oil prices, recent diplomatic progress between Washington and Tehran has eased concerns about a prolonged supply shock.

Regime change: Inside Kevin Warsh's first move to make the Fed unreadable on purpose

The rate did not move. That was the least interesting thing about Kevin Warsh's first meeting in charge of the Fed. The FOMC held its benchmark at 3.50%-3.75% for the fourth straight meeting, exactly as priced, and then the new chair used his first press conference to dismantle the machinery the market has leaned on for a decade.