EUR/USD looks for bullish push ahead of final EU GDP and US NFP data drops
- EUR/USD bulls keep bids buoyed on Thursday, but technical ceiling remains.
- Broader markets looking ahead to Friday’s US NFP print.
- Fed rate cut hopes pin into September, ECB unlikely to bring a follow-up cut.

EUR/USD pushed back into near-term highs on Thursday, easing below 1.0870 in early market action before recovering ground and re-pinning into familiar technical levels just below 1.0900 to close out the US market session.
The European Central Bank (ECB) delivered a hotly-anticipated quarter-point rate cut this week, but according to sources within the ECB, it is unlikely that ECB policymakers will be delivering a follow-up cut in July as many investors had widely expected. With markets broadly expecting a quarter-point cut from the Federal Reserve (Fed) in September, it is unlikely that the rate differential between the Euro and Greenback will widen as much as initial expectations.
According to the CME’s FedWatch Tool, rate traders are pricing in 70% odds of at least a 25 basis point trim from the Fed when it gathers in September.
European final Gross Domestic Product (GDP) figures are slated for early Friday, but markets are not expecting any wide swings from preliminary figures. QoQ Q1 pan-EU GDP is expected to print at 0.3% with annualized YoY GDP expected at 0.4%.
US Nonfarm Payrolls (NFP) labor figures will dominate market focus on Friday, and median market forecasts are expecting May’s net US job additions to rise to 185K from the previous month’s 175K. US Average Hourly Earnings are also expected to rise 0.3% MoM compared to the previous 0.2%.
An appearance from ECB President Christine Lagarde, slated to come later in the US market window, will round out the trading week’s key schedule events.
EUR/USD technical outlook
EUR/USD is building out a technical base after breaking through descending trendlines this week, and the pair is poised for an extension after pricing in a bullish rebound from the 200-day Exponential Moving Average (EMA) at 1.0807. The pair is marred in medium-term consolidation patterns, but a pullback towards the 1.0800 handle could see bidders return to the fold as the 50-day EMA crosses over the long-term MA.
EUR/USD daily chart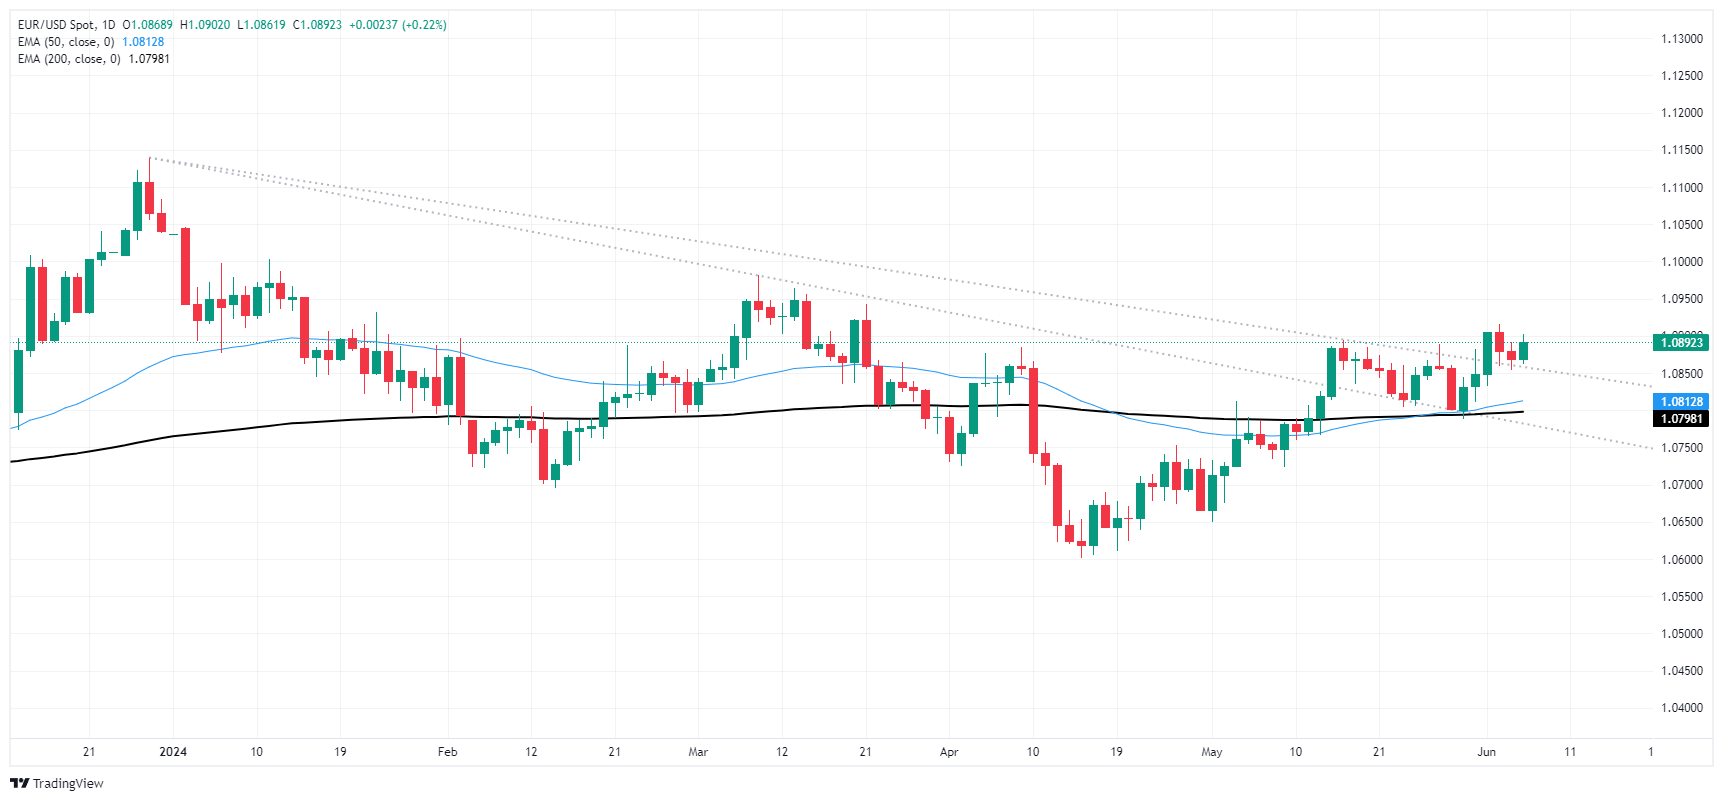
Author

Joshua Gibson
FXStreet
Joshua joins the FXStreet team as an Economics and Finance double major from Vancouver Island University with twelve years' experience as an independent trader focusing on technical analysis.


