EUR/USD finds thin gains on Friday, remains capped below 1.0800
- EUR/USD found some room higher but still lacks upside momentum.
- Final German HICP and CPI inflation brought no surprises.
- US CPI inflation, EU GDP figures slated for next week.

The EUR/USD found some room on the high side on Friday, continuing a near-term recovery. However, the pair remains firmly planted on the low side of technical barriers and remains pinned below the 1.0800 price handle.
German inflation figures brought nothing new to the table, confirming initial flash prints, and an adjustment by the US Bureau of Labor Statistics (BLS) made anticipated changes to how seasonal adjustment is calculated in US Consumer Price Index (CPI) figures. Markets jostled after the BLS adjustment, but US inflation figures saw little change, keeping markets on-balance for Friday.
Daily digest market movers: EUR/USD continues slow grind higher as technical ceiling weighs
- Germany’s final Harmonized Index of Consumer Price (HICP) showed no changes from preliminary prints, with the annualized German inflation rate through January holding at 3.1%.
- The US BLS made changes to how seasonal adjustment works for US CPI numbers, with a slight rise in annualized inflation getting offset by a near-term decline after calculations got adjusted.
- US December monthly CPI revised to 0.2% from 0.3%
- Next week brings a fresh print of US CPI inflation, with the YoY CPI through January expected to tick down from 3.4% to 3.0%.
- US CPI inflation slated for Tuesday, European Gross Domestic Product (GDP) figures due Wednesday.
- Pan-European GDP growth is expected to remain pinned in low territory.
- YoY quarterly EU GDP is forecast to print at 0.1%, in-line with the previous annualized quarterly print.
Euro price today
The table below shows the percentage change of Euro (EUR) against listed major currencies today. Euro was the strongest against the Swiss Franc.
| USD | EUR | GBP | CAD | AUD | JPY | NZD | CHF | |
| USD | -0.09% | -0.09% | 0.00% | -0.43% | 0.00% | -0.75% | 0.13% | |
| EUR | 0.09% | 0.00% | 0.09% | -0.35% | 0.08% | -0.66% | 0.22% | |
| GBP | 0.09% | -0.01% | 0.10% | -0.34% | 0.09% | -0.66% | 0.22% | |
| CAD | -0.01% | -0.09% | -0.09% | -0.42% | -0.01% | -0.76% | 0.12% | |
| AUD | 0.43% | 0.32% | 0.32% | 0.41% | 0.42% | -0.32% | 0.56% | |
| JPY | 0.01% | -0.08% | -0.07% | 0.00% | -0.44% | -0.72% | 0.15% | |
| NZD | 0.75% | 0.66% | 0.66% | 0.75% | 0.32% | 0.75% | 0.88% | |
| CHF | -0.14% | -0.23% | -0.22% | -0.13% | -0.56% | -0.13% | -0.89% |
The heat map shows percentage changes of major currencies against each other. The base currency is picked from the left column, while the quote currency is picked from the top row. For example, if you pick the Euro from the left column and move along the horizontal line to the Japanese Yen, the percentage change displayed in the box will represent EUR (base)/JPY (quote).
Technical analysis: EUR/USD struggles to grow legs beneath technical recovery
The EUR/USD remains pinned on the south side of the 200-hour Simple Moving Average (SMA) just beneath 1.0800. Although the pair continues to recover into the upside from the early week’s bottom near 1.0725, topside momentum remains capped, with longer-term technical patterns remaining decidedly bearish.
Despite posting three straight days of gains and on pace for a fourth, the EUR/USD remains on the bearish side of the 200-day SMA at 1.0833. The pair is still down over 3% from late December’s peak of 1.1140, and Euro bidders are struggling to lift the Euro off the floor of a nearly 4% decline into January’s bottom bids of 1.0722.
EUR/USD hourly chart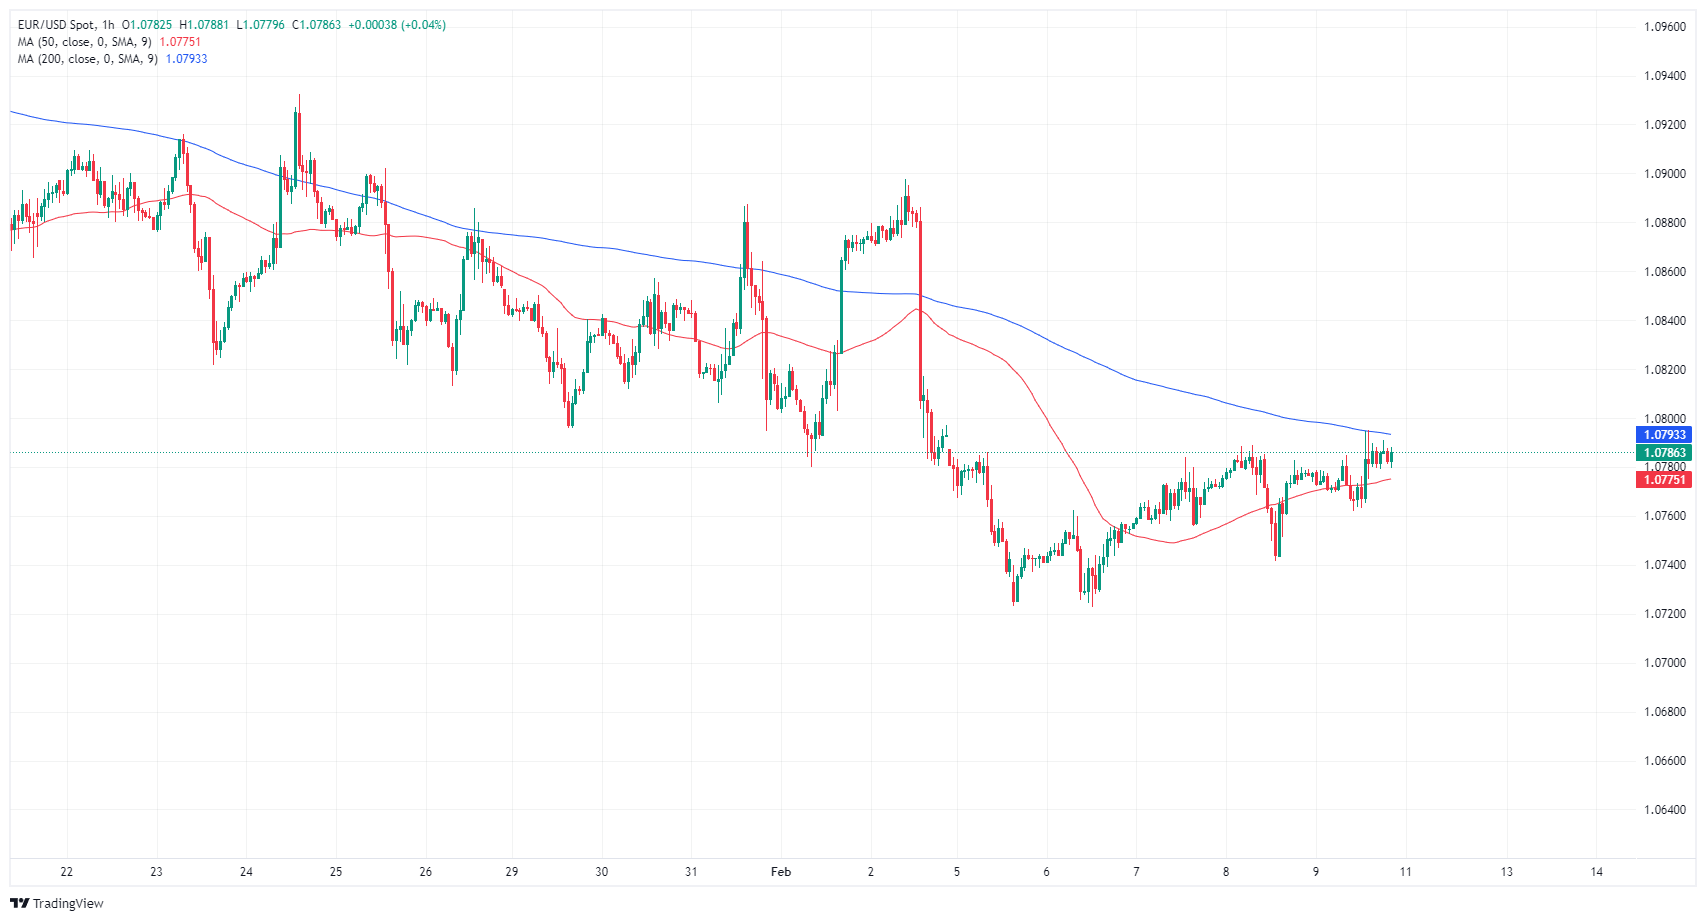
EUR/USD daily chart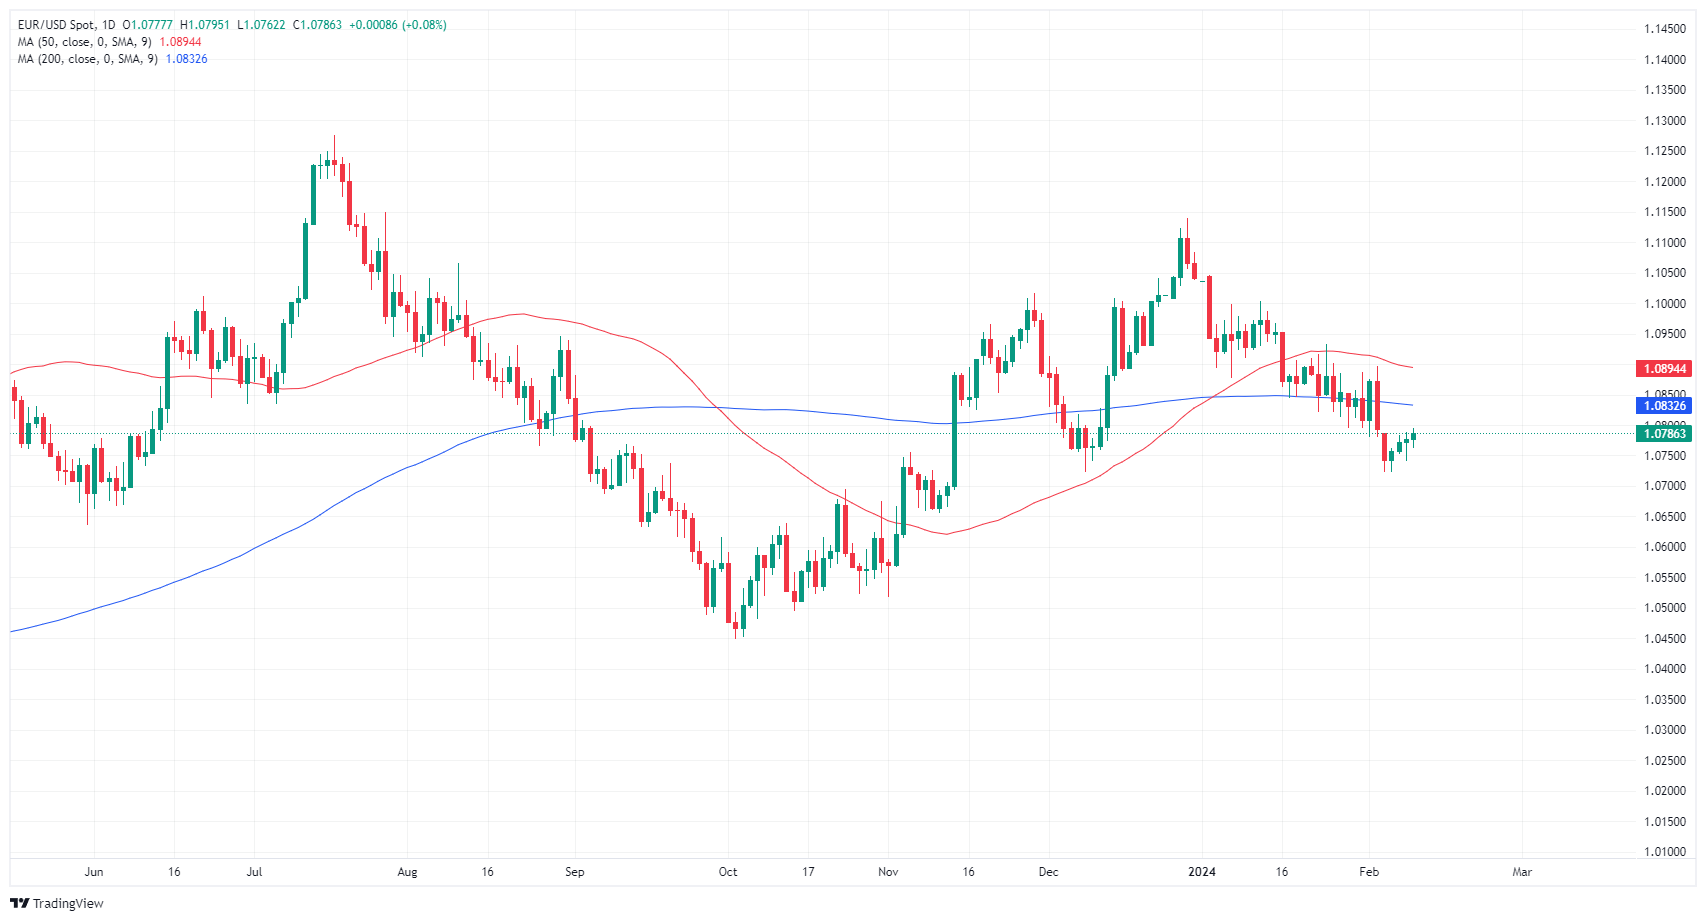
Risk sentiment FAQs
What do the terms"risk-on" and "risk-off" mean when referring to sentiment in financial markets?
In the world of financial jargon the two widely used terms “risk-on” and “risk off'' refer to the level of risk that investors are willing to stomach during the period referenced. In a “risk-on” market, investors are optimistic about the future and more willing to buy risky assets. In a “risk-off” market investors start to ‘play it safe’ because they are worried about the future, and therefore buy less risky assets that are more certain of bringing a return, even if it is relatively modest.
What are the key assets to track to understand risk sentiment dynamics?
Typically, during periods of “risk-on”, stock markets will rise, most commodities – except Gold – will also gain in value, since they benefit from a positive growth outlook. The currencies of nations that are heavy commodity exporters strengthen because of increased demand, and Cryptocurrencies rise. In a “risk-off” market, Bonds go up – especially major government Bonds – Gold shines, and safe-haven currencies such as the Japanese Yen, Swiss Franc and US Dollar all benefit.
Which currencies strengthen when sentiment is "risk-on"?
The Australian Dollar (AUD), the Canadian Dollar (CAD), the New Zealand Dollar (NZD) and minor FX like the Ruble (RUB) and the South African Rand (ZAR), all tend to rise in markets that are “risk-on”. This is because the economies of these currencies are heavily reliant on commodity exports for growth, and commodities tend to rise in price during risk-on periods. This is because investors foresee greater demand for raw materials in the future due to heightened economic activity.
Which currencies strengthen when sentiment is "risk-off"?
The major currencies that tend to rise during periods of “risk-off” are the US Dollar (USD), the Japanese Yen (JPY) and the Swiss Franc (CHF). The US Dollar, because it is the world’s reserve currency, and because in times of crisis investors buy US government debt, which is seen as safe because the largest economy in the world is unlikely to default. The Yen, from increased demand for Japanese government bonds, because a high proportion are held by domestic investors who are unlikely to dump them – even in a crisis. The Swiss Franc, because strict Swiss banking laws offer investors enhanced capital protection.
Author

Joshua Gibson
FXStreet
Joshua joins the FXStreet team as an Economics and Finance double major from Vancouver Island University with twelve years' experience as an independent trader focusing on technical analysis.


