|

EUR/JPY Price Forecast: Pulling back within persistent short-term downtrend

  • EUR/JPY is pulling back within a month-long downtrend. 
  • Despite some bullish signs the short-term trend remains bearish.

EUR/JPY is pulling back after making a lower low on its persistent journey south.

Since the August 16 high the pair has steadily declined, tracing out a sequence of falling peaks and troughs which indicates EUR/JPY has established a short-term downtrend. According to technical analysis theory this favors more downside because “the trend is your friend”. 

EUR/JPY 4-hour Chart 

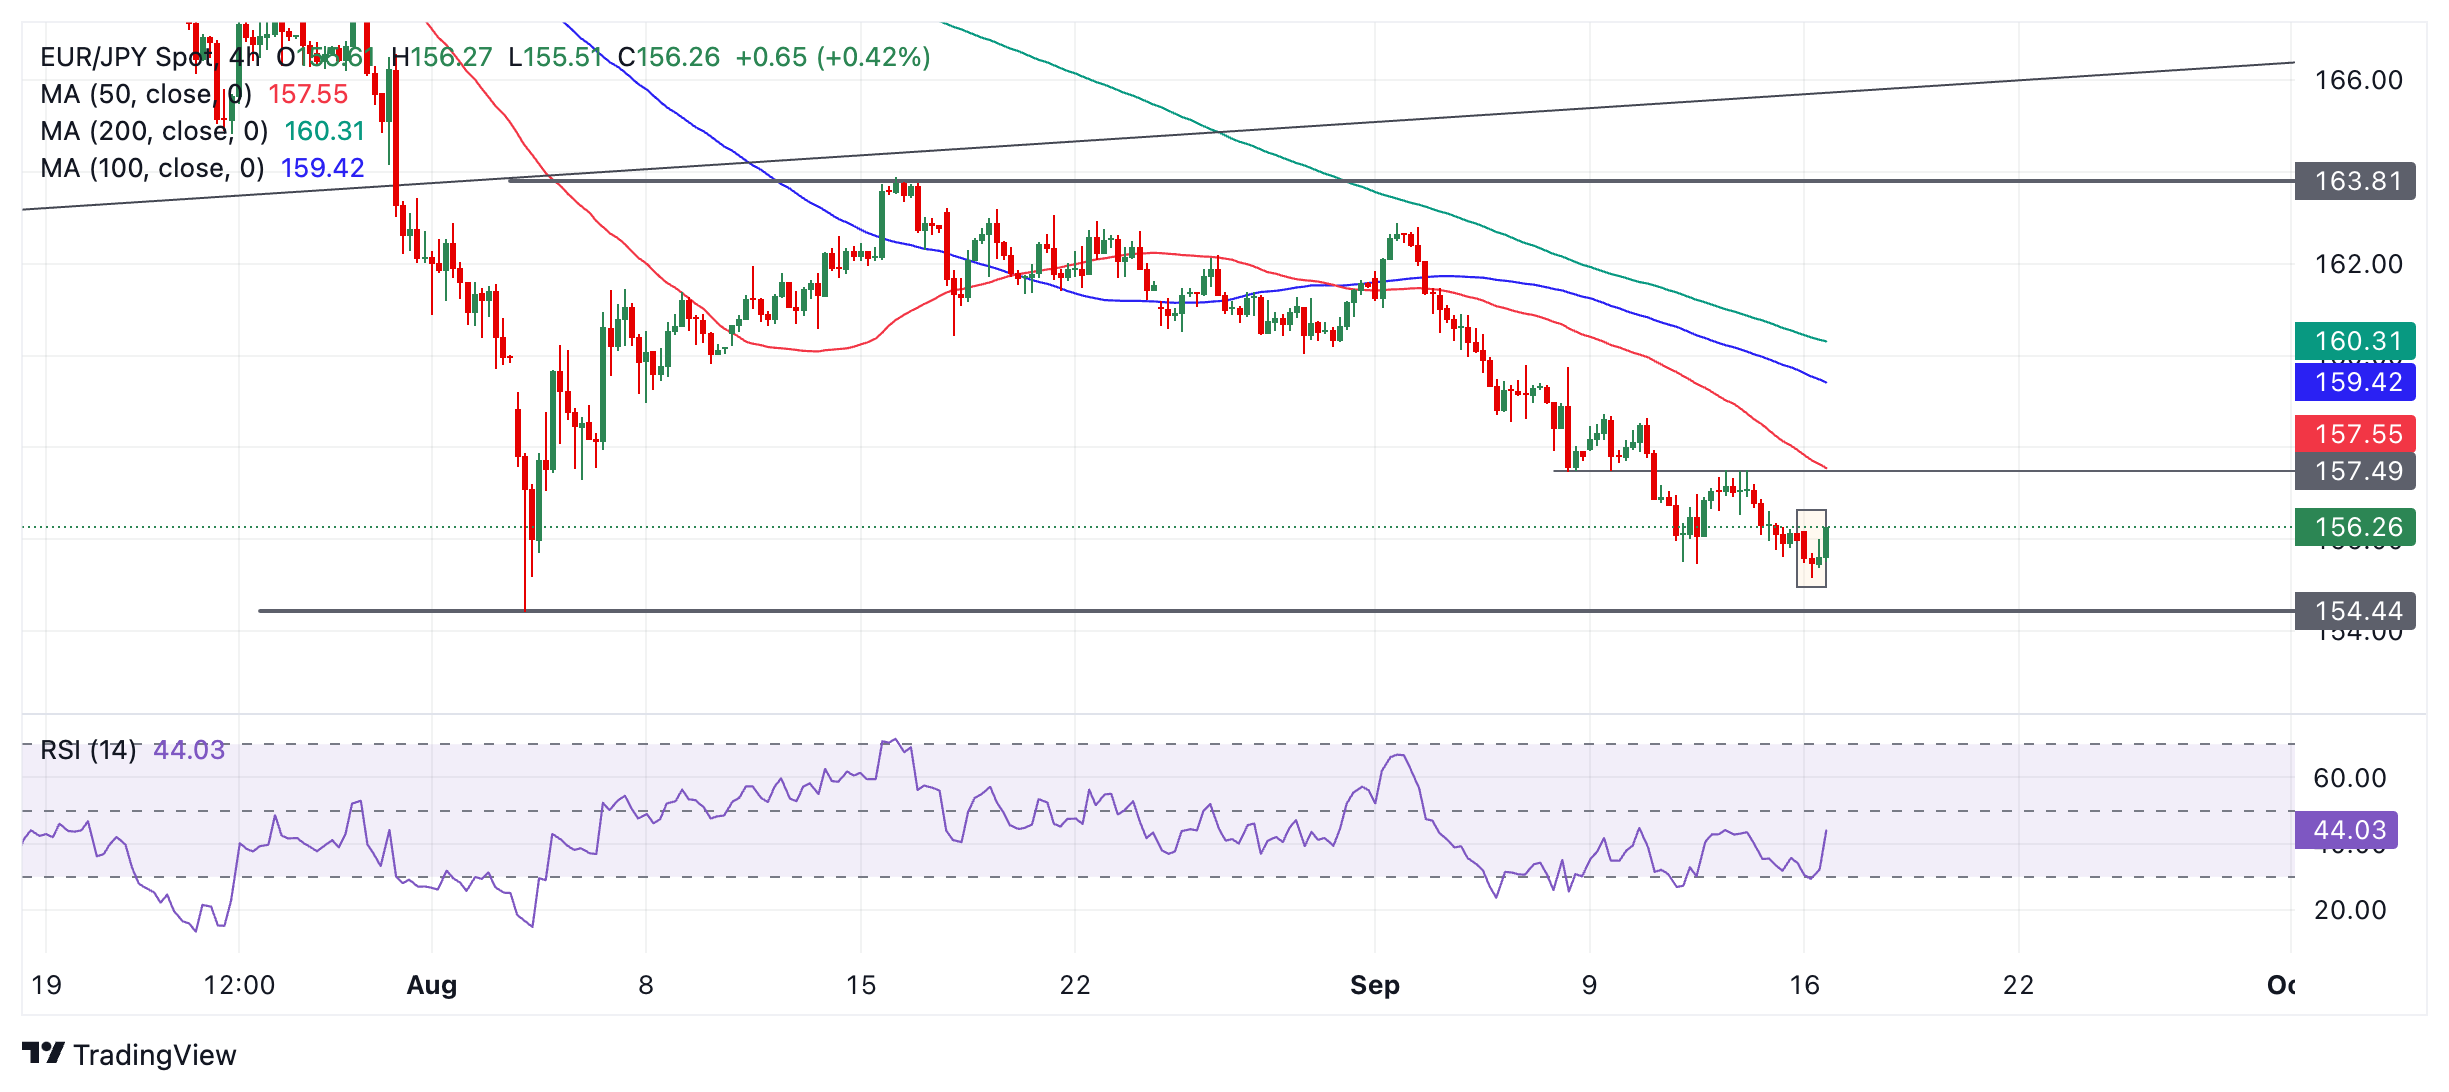
The last few periods, however, have formed a Japanese Hammer candlestick reversal pattern (shaded rectangle on chart). This Hammer was followed by a confirmatory green bullish candlestick. The current period is also strongly bullish – so far although it has not finished. 

At the same time the Relative Strength Index (RSI) has moved from oversold back into neutral. This advises traders to close short positions and open long positions. 

The correction lacks upside so far, however, which means there is not enough evidence from price action to indicate EUR/JPY has reversed its short-term downtrend. 

It is showing bullish warning signs though, and if price can close above 157.49 it will suggest the short-term trend has reversed and the odds favor more upside. 

Alternatively the pull back could soon run out of steam, allowing price to resume its downtrending bias. A break below 155.15 (September 16 low) would provide confirmation of a continuation of the bear trend to the next target at 154.44 – the August 5 low. 

A break below that would be an even more bearish sign and suggest a probable reversal of the long-term uptrend.

Author

Joaquin Monfort

Joaquin Monfort is a financial writer and analyst with over 10 years experience writing about financial markets and alt data. He holds a degree in Anthropology from London University and a Diploma in Technical analysis.

More from Joaquin Monfort
Share:

Editor's Picks

EUR/USD consolidates around 1.0900, bullish bias remains ahead of key US data

The EUR/USD pair is seen consolidating its strong gains registered over the past two days and oscillating in a narrow band during the Asian session on Tuesday. Spot prices currently trade around the 1.1900 mark, just below an over one-week high touched the previous day.

GBP/USD tilts bullish as markets barrel toward mid-week NFP print

GBP/USD is holding a broader bullish structure on the daily chart, with price trading well above the 50 Exponential Moving Average at 1.3507 and the 200 EMA at 1.3310, confirming the intermediate uptrend that has been in place since the November 2025 low near 1.2300. 

Gold: Will US Retail Sales data propel it above $5,100?

Gold hovers below weekly highs of $5,087 early Tuesday, await US Retail Sales data. The US Dollar enters a downside consolidation phase amid persistent Japanese Yen strength and worsening labor market. Gold settled Monday above $5,000, now looks to take out $5,100 amid bullish daily RSI.

Top Crypto Gainers: World Liberty Financial, MemeCore and Quant gain momentum

World Liberty Financial, MemeCore, and Quant are leading gains over the last 24 hours as the broader cryptocurrency market stabilizes after last week’s correction. Still, the technical outlook for altcoins remains mixed due to prevailing downside pressure and vulnerable market sentiment. 

The market is buying everything again but is it dancing on a borrowed floor

The market has a short memory and a fast trigger finger. Last week’s liquidation barely cooled before risk came roaring back, pushing the S&P toward record territory and reinstalling Big Tech as the engine of choice. This is not discovery. It is re exposure.

Ripple exposed to volatility amid low retail interest, modest fund inflows

Ripple (XRP) is extending its intraday decline to around $1.40 at the time of writing on Monday amid growing pressure from the retail market and risk-off sentiment that continues to keep investors on the sidelines.