EUR/JPY Price Analysis: Pares the biggest daily gains in two months below 144.00


  • EUR/JPY retreats from three-week-old resistance line, depressed near the intraday low of late.
  • Multiple hurdles stand tall to challenge bears; bulls need validation from 144.20.
  • RSI’s retreat from overbought territory suggests a mild pullback in prices, bullish MACD signals favor buyers.

EUR/JPY licks its wounds around the intraday low of 143.50 as it consolidates the previous day’s heavy gains during early Thursday in Europe.

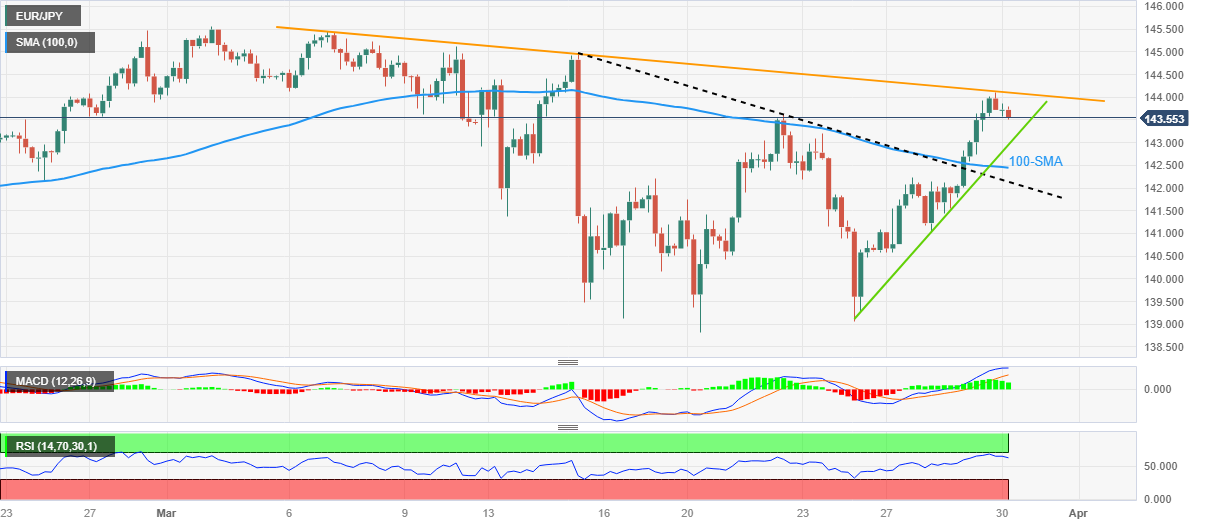
The cross-currency pair rallied the most since early January 2023 before reversing from a downward-sloping trend line from March 07. The pullback moves also take clues from the RSI’s (14) retreat from the overbought territory. As a result, the quote’s short-term downside can’t be ruled out.

However, an upward-sloping support line from the last Friday, close to 143.00 at the latest, restricts the immediate downside of the EUR/JPY.

Following that, the 100-SMA and a two-week-long previous resistance line, respectively near 142.45 and 142.10 in that order, could challenge the EUR/JPY bears. It’s worth noting that the 142.00 round figure acts as the last defense of the pair buyers.

On the contrary, recovery moves need a clear upside break of the aforementioned three-week-old resistance line, around 144.20 at the latest.

In that case, the monthly high of around 145.50 may act as an intermediate halt before fueling the price towards the multi-year top marked in February, around 148.40.

Overall, EUR/JPY remains on the bull’s radar despite the latest pullback.

EUR/JPY: Four-hour chart

Limited downside expected

Additional important levels

Overview
Today last price 143.63
Today Daily Change -0.44
Today Daily Change % -0.31%
Today daily open 144.07
 
Trends
Daily SMA20 142.94
Daily SMA50 142.47
Daily SMA100 142.53
Daily SMA200 141.83
 
Levels
Previous Daily High 144.1
Previous Daily Low 141.79
Previous Weekly High 143.63
Previous Weekly Low 138.83
Previous Monthly High 145.47
Previous Monthly Low 139.55
Daily Fibonacci 38.2% 143.22
Daily Fibonacci 61.8% 142.68
Daily Pivot Point S1 142.54
Daily Pivot Point S2 141.01
Daily Pivot Point S3 140.23
Daily Pivot Point R1 144.85
Daily Pivot Point R2 145.63
Daily Pivot Point R3 147.16


Share: Feed news

Information on these pages contains forward-looking statements that involve risks and uncertainties. Markets and instruments profiled on this page are for informational purposes only and should not in any way come across as a recommendation to buy or sell in these assets. You should do your own thorough research before making any investment decisions. FXStreet does not in any way guarantee that this information is free from mistakes, errors, or material misstatements. It also does not guarantee that this information is of a timely nature. Investing in Open Markets involves a great deal of risk, including the loss of all or a portion of your investment, as well as emotional distress. All risks, losses and costs associated with investing, including total loss of principal, are your responsibility. The views and opinions expressed in this article are those of the authors and do not necessarily reflect the official policy or position of FXStreet nor its advertisers. The author will not be held responsible for information that is found at the end of links posted on this page.

If not otherwise explicitly mentioned in the body of the article, at the time of writing, the author has no position in any stock mentioned in this article and no business relationship with any company mentioned. The author has not received compensation for writing this article, other than from FXStreet.

FXStreet and the author do not provide personalized recommendations. The author makes no representations as to the accuracy, completeness, or suitability of this information. FXStreet and the author will not be liable for any errors, omissions or any losses, injuries or damages arising from this information and its display or use. Errors and omissions excepted.

The author and FXStreet are not registered investment advisors and nothing in this article is intended to be investment advice.

Recommended content


Recommended content

Editors’ Picks

AUD/USD posts gain, yet dive below 0.6500 amid Aussie CPI, ahead of US GDP

AUD/USD posts gain, yet dive below 0.6500 amid Aussie CPI, ahead of US GDP

The Aussie Dollar finished Wednesday’s session with decent gains of 0.15% against the US Dollar, yet it retreated from weekly highs of 0.6529, which it hit after a hotter-than-expected inflation report. As the Asian session begins, the AUD/USD trades around 0.6495.

AUD/USD News

USD/JPY finds its highest bids since 1990, approaches 156.00

USD/JPY finds its highest bids since 1990, approaches 156.00

USD/JPY broke into its highest chart territory since June of 1990 on Wednesday, peaking near 155.40 for the first time in 34 years as the Japanese Yen continues to tumble across the broad FX market. 

USD/JPY News

Gold stays firm amid higher US yields as traders await US GDP data

Gold stays firm amid higher US yields as traders await US GDP data

Gold recovers from recent losses, buoyed by market interest despite a stronger US Dollar and higher US Treasury yields. De-escalation of Middle East tensions contributed to increased market stability, denting the appetite for Gold buying.

Gold News

Ethereum suffers slight pullback, Hong Kong spot ETH ETFs to begin trading on April 30

Ethereum suffers slight pullback, Hong Kong spot ETH ETFs to begin trading on April 30

Ethereum suffered a brief decline on Wednesday afternoon despite increased accumulation from whales. This follows Ethereum restaking protocol Renzo restaked ETH crashing from its 1:1 peg with ETH and increased activities surrounding spot Ethereum ETFs.

Read more

Dow Jones Industrial Average hesitates on Wednesday as markets wait for key US data

Dow Jones Industrial Average hesitates on Wednesday as markets wait for key US data

The DJIA stumbled on Wednesday, falling from recent highs near 38,550.00 as investors ease off of Tuesday’s risk appetite. The index recovered as US data continues to vex financial markets that remain overwhelmingly focused on rate cuts from the US Fed.

Read more

Forex MAJORS

Cryptocurrencies

Signatures