|

EUR/GBP technical analysis: 200-HMA can limit immediate rise inside ascending triangle

  • Nearby key resistances to question EUR/GBP recovery from mid-month bottom.
  • A downside break of pattern support could exert fresh selling pressure.

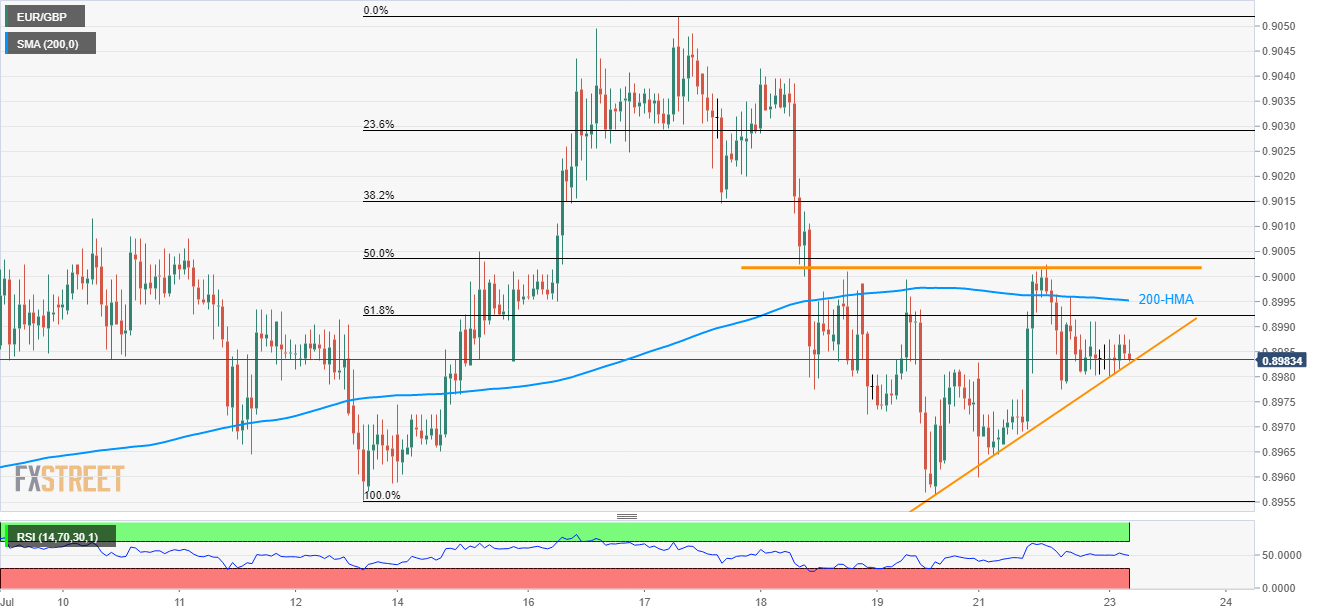
Despite repeated failures to slip beneath 2-day long rising support-line, EUR/GBP upside is likely to be tamed by short-term key resistances as it takes the rounds to 0.8980 ahead of the European open on Tuesday.

The first one being 200-hour moving average (HMA) level of 0.8995, close to the rising triangle’s upper-line at 0.9000 round-figure.

Should prices rally beyond 0.9000, 38.2% Fibonacci retracement level of 0.9015 and July 17 high around 0.9050 can please the bulls.

Though, a downside break of 0.8980 comprising pattern support might not hesitate to drag the quote to 0.8955 whereas 0.8900 round-figure could be on the bears’ radar then after.

EUR/GBP hourly chart

Trend: Pullback expected

    1. R3 0.9048 
    2. R2 0.9025 
    3. R1 0.9006 
  1. PP 0.8983 
    1. S1 0.8963 
    2. S2 0.8940 
    3. S3 0.8921

Author

Anil Panchal

Anil Panchal

FXStreet

Anil Panchal has nearly 15 years of experience in tracking financial markets. With a keen interest in macroeconomics, Anil aptly tracks global news/updates and stays well-informed about the global financial moves and their implications.

More from Anil Panchal
Share:

Editor's Picks

EUR/USD tests nine-day EMA support near 1.1850

EUR/USD inches lower during the Asian hours on Monday, trading around 1.1870 at the time of writing. The 14-day Relative Strength Index momentum indicator at 56 stays above the midline, confirming improving momentum. RSI has cooled from prior overbought readings but stabilizes above 50, suggesting dips could stay limited before buyers reassert control.

GBP/USD flat lines as traders await key UK macro data and FOMC minutes

The GBP/USD pair kicks off a new week on a subdued note and oscillates in a narrow range, just below mid-1.3600s, during the Asian session. Moreover, the mixed fundamental backdrop warrants some caution for aggressive traders as the market focus now shifts to this week's important releases from the UK and the US.

Gold buyers hesitate amid holiday-thinned trading

Gold trades volatile, but within range, as US, China holidays-led thin trading exaggerates moves. The US Dollar extends range play into the US GDP week, with markets pricing at least two Fed rate cuts this year. Technically, Gold tests key support at $5,000; daily RSI still remains bullish.

Top Crypto Losers: Dogecoin, Zcash, Bonk – Meme and Privacy coins under pressure

Meme coins such as Dogecoin and Bonk, alongside the privacy coin Zcash (ZEC), are leading the broader market losses over the last 24 hours. DOGE, ZEC, and BONK ended their three consecutive days of recovery with a sudden decline on Sunday, as crucial resistance levels capped the gains. Technically, the altcoins show downside risk, starting the week under pressure.

Global inflation watch: Signs of cooling services inflation

Realized inflation landed close to expectations in January, as negative base effects weighed on the annual rates. Remaining sticky inflation is largely explained by services, while tariff-driven goods inflation remains limited even in the US.

Ripple Price Forecast: XRP potential bottom could be in sight

Ripple edges up above the intraday low of $1.35 at the time of writing on Friday amid mixed price actions across the crypto market. The remittance token failed to hold support at $1.40 the previous day, reflecting risk-off sentiment amid a decline in retail and institutional sentiment.