|

EUR/GBP Price Analysis: Signs the downtrend could be resuming

  • EUR/GBP forms a two bar reversal pattern and begins descending. 
  • This comes after price has filled a gap on the charts – another reversal sign. 
  • Evidence is building that the correction from the June 14 lows has rolled over and the intermediate downtrend is resuming. 

EUR/GBP is potentially resuming its medium-term downtrend after correcting higher since the June 14 lows. 

EUR/GBP Daily Chart 

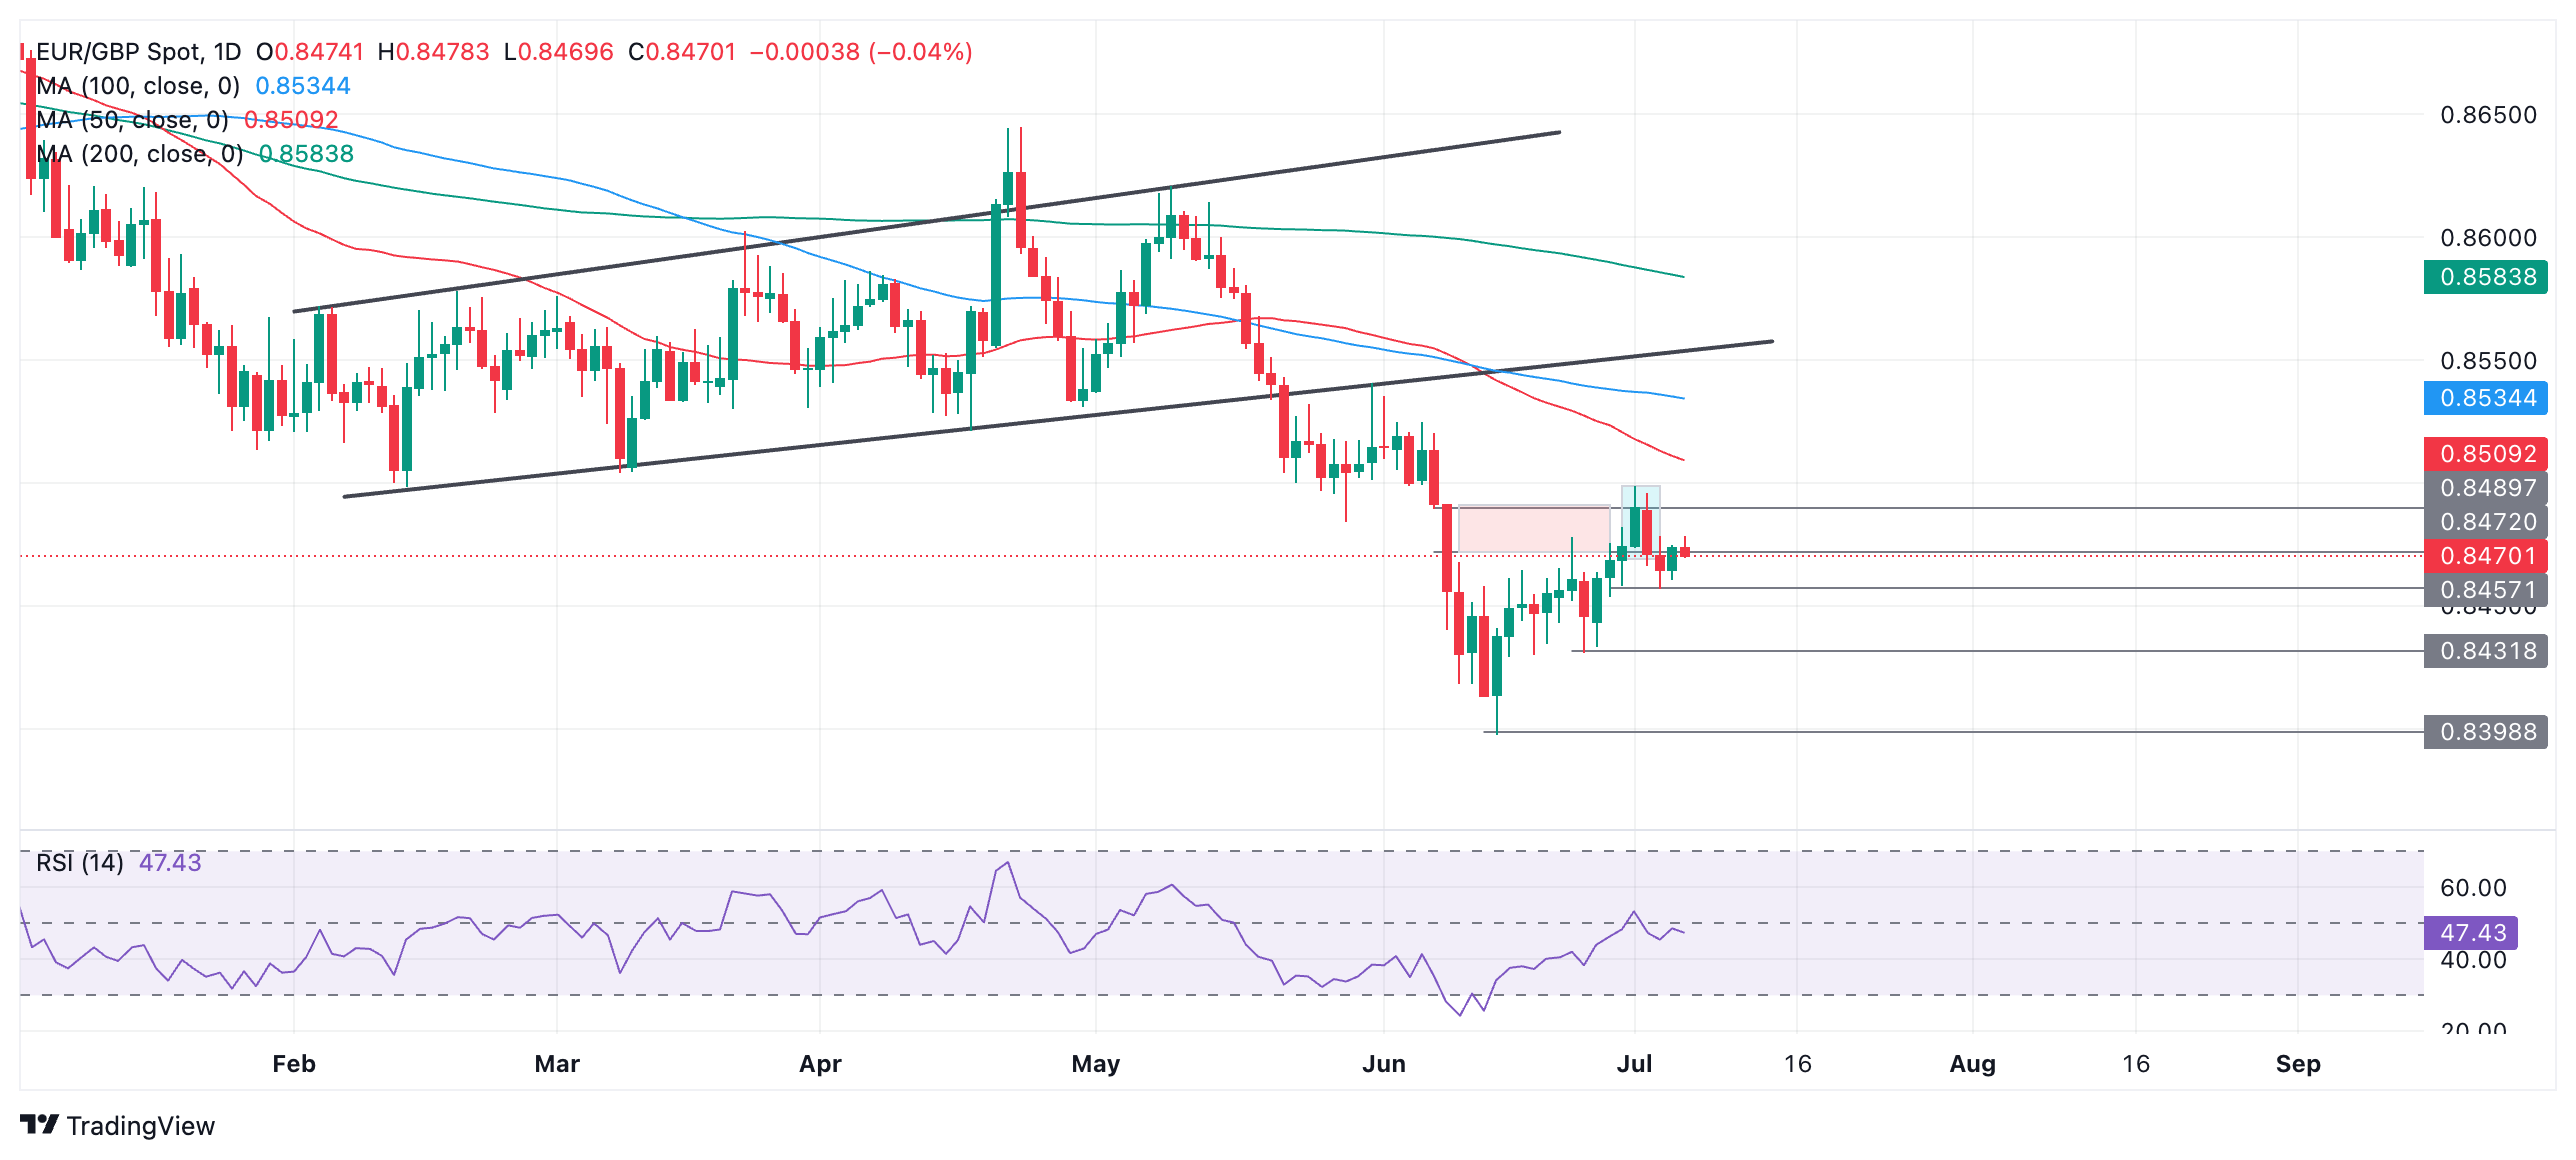
The pair has formed a two-bar reversal pattern at the peak of the correction, on July 1-2 (light blue rectangle) which is a bearish indicator. Two-bar reversals occur when price peaks and forms a green candle which is succeeded by a red candle of a similar shape and size. The fact that the day after the pattern was also bearish is further confirmation. 

EUR/GBP 4-hour Chart


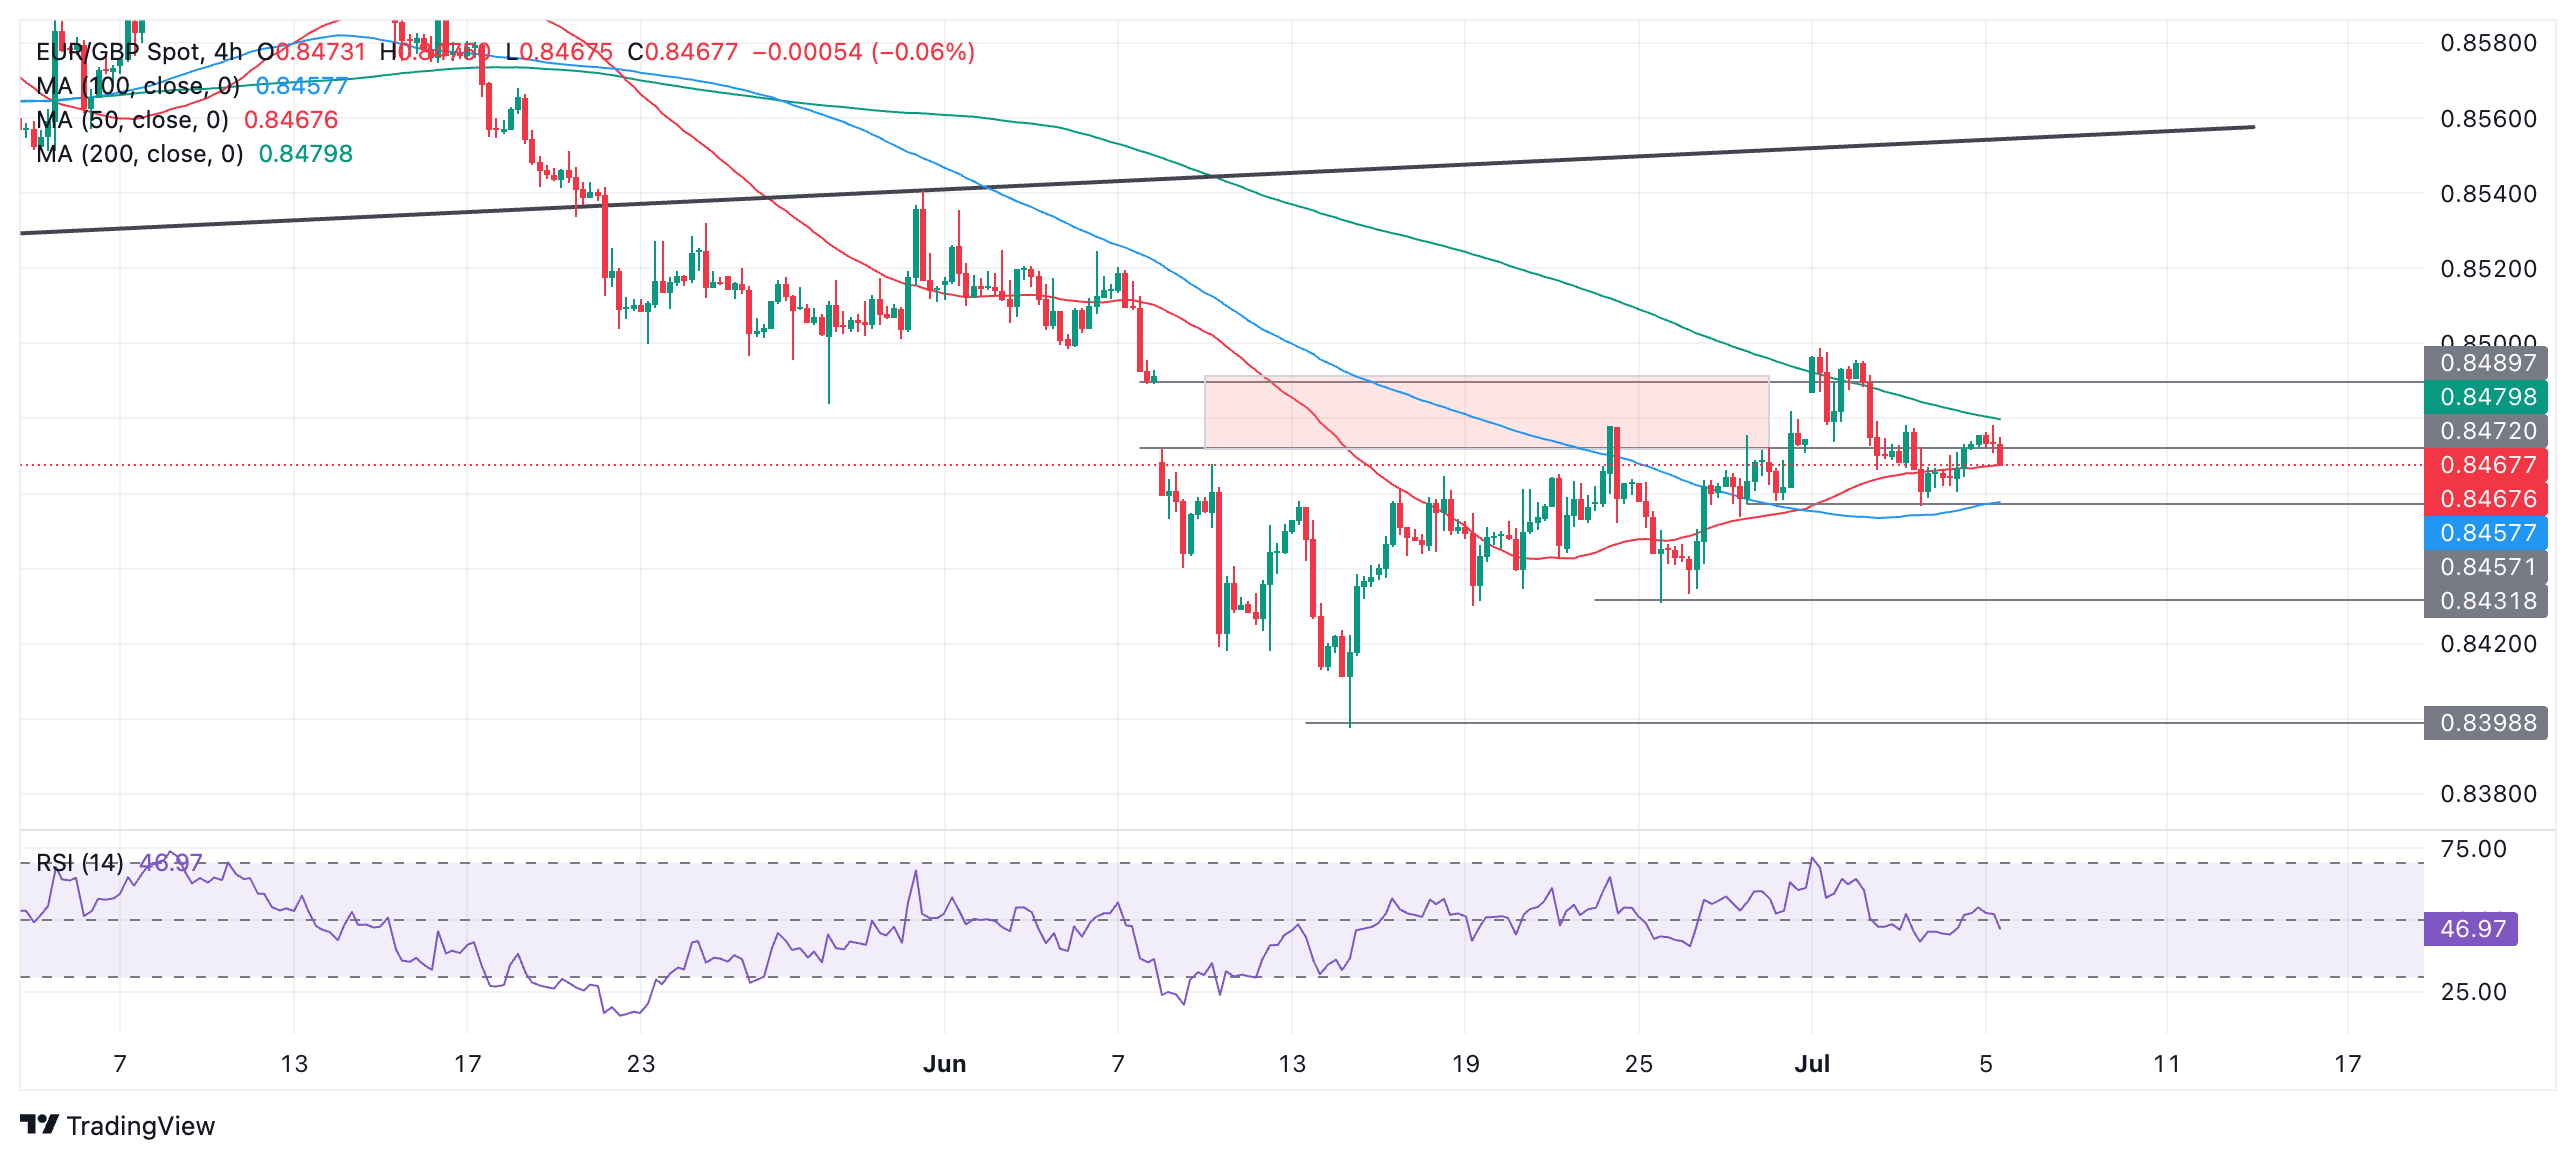
A further indication the dominant downtrend is resuming is that EUR/GBP has filled the price gap that opened between 0.8472 and 0.8490 (red shaded area). This gap can be seen on the 4-hour chart above.

It is said prices are often drawn to fill gaps and now they have there is more chance the downtrend will resume. 

A break below 0.8458 (July 3 and June 28 low) would provide added bearish confirmation. 

The next downside target would be the 0.8431 June 25 low. 

Alternatively if the pair recovers, and breaks above 0.8499 (July 1) it could indicate a continuation of the correction higher, with the 50-day Simple Moving Average at 0.8517 providing resistance and the next target to the upside. 

Author

Joaquin Monfort

Joaquin Monfort is a financial writer and analyst with over 10 years experience writing about financial markets and alt data. He holds a degree in Anthropology from London University and a Diploma in Technical analysis.

More from Joaquin Monfort
Share:

Editor's Picks

EUR/USD deflates to fresh lows, targets 1.1600

The selling pressure on EUR/USD now gathers extra pace, prompting the pair to hit fresh multi-week lows in the 1.1625-1.1620 band on Friday. The continuation of the downward bias comes in response to further gains in the US Dollar as market participants continue to assess the mixed release of US Nonfarm Payrolls in December.

GBP/USD breaks below 1.3400, challenges the 200-day SMA

GBP/USD remains under heavy fire and retreats for the fourth consecutive day on Friday. Indeed, Cable suffers the strong performance of the Greenback, intensified post-mixed NFP, and trades at shouting distance from its critical 200-day SMA near 1.3380.

Gold flirts with yearly tops around $4,500

Gold keeps its positive bias on Friday, adding to Thursday’s advance and challenging yearly highs in the $4,500 region per troy ounce. The risk-off sentiment favours the yellow metal despite the firmer tone in the Greenback and rising US Treasury yields.

Crypto Today: Bitcoin, Ethereum, XRP risk further decline as market fear persists amid slowing demand

Bitcoin holds $90,000 but stays below the 50-day EMA as institutional demand wanes. Ethereum steadies above $3,000 but remains structurally weak due to ETF outflows. XRP ETFs resume inflows, but the price struggles to gain ground above key support.

Week ahead – US CPI might challenge the geopolitics-boosted Dollar

Geopolitics may try to steal the limelight from US data. A possible US Supreme Court ruling on tariffs could dictate market movements. A crammed data calendar next week, US CPI comes on Tuesday; Fedspeak to intensify.

XRP trades under pressure amid weak retail demand

XRP presses down on the 50-day EMA support as risk-averse sentiment spreads despite a positive start to 2026. XRP faces declining retail demand, as reflected in futures Open Interest, which has fallen to $4.15 billion.