Dutch Bros stock spirals lower as company misses revenue guidance projection
- Dutch Bros stock gets shunted below $30 per share.
- Market seems overly pessimistic on a mere $5 million miss on full-year sales guidance.
- BROS profits, revenue overpower Wall Street consensus for Q2.
- NASDAQ, S&P 500 trend higher as Initial Jobless Claims come in below forecast.

Make no mistake. Dutch Bros (BROS) had a terrific second quarter. At first glance, however, with the share price plunging 22% on Thursday to $29.40, traders might think otherwise.
But Dutch Bros is simply a victim of its own success. The Oregon-founded coffee shop that targets America’s suburban drive-thru consumer is selling off due to a slight miss on Wall Street’s future revenue guidance.
The performance appears so much worse since the broad equity market is thriving on Thursday following a jobless report showing that new jobless claims are not as bad as feared following last week’s rise in the Unemployment Rate. The NASDAQ has garnered a 2.1% lift on Thursday at the time of writing near lunchtime, while the S&P 500 advances around 1.7%.
Dutch Bros sales growth settles down alongside strapped American consumer
The almost silly reason for the BROS stock sell-off is that management placed the midpoint of their fiscal 2024 revenue projection at $1.225 billion, whereas Wall Street has a consensus figure closer to $1.23 billion.
Yes, you read that correctly. BROS stock has sold off by about $1.5 billion in market cap due to a difference of $5 million in revenue guidance. Go figure!
But a lot can go wrong when a high-growth stock is trading at 100 times adjusted earnings and 200 times GAAP earnings, which was the case with Dutch Bros.
More importantly, Dutch Bros reported Q2 adjusted earnings per share (EPS) of $0.19, which was nearly 50% higher than the consensus of $0.13.
Revenue of $325 million came in more than $7 million ahead of expectations in Q2 and rose 30% from a year earlier.
“In Q2, we opened 36 new shops marking the 12th consecutive quarter of 30 or more new shop openings,” said CEO Christine Barone on the earnings call. That figure put Dutch Bros over the 900 location level and on track for 1,000 locations in the first half of 2025.
S&P 500 FAQs
The S&P 500 is a widely followed stock price index which measures the performance of 500 publicly owned companies, and is seen as a broad measure of the US stock market. Each company’s influence on the computation of the index is weighted based on market capitalization. This is calculated by multiplying the number of publicly traded shares of the company by the share price. The S&P 500 index has achieved impressive returns – $1.00 invested in 1970 would have yielded a return of almost $192.00 in 2022. The average annual return since its inception in 1957 has been 11.9%.
Companies are selected by committee, unlike some other indexes where they are included based on set rules. Still, they must meet certain eligibility criteria, the most important of which is market capitalization, which must be greater than or equal to $12.7 billion. Other criteria include liquidity, domicile, public float, sector, financial viability, length of time publicly traded, and representation of the industries in the economy of the United States. The nine largest companies in the index account for 27.8% of the market capitalization of the index.
There are a number of ways to trade the S&P 500. Most retail brokers and spread betting platforms allow traders to use Contracts for Difference (CFD) to place bets on the direction of the price. In addition, that can buy into Index, Mutual and Exchange Traded Funds (ETF) that track the price of the S&P 500. The most liquid of the ETFs is State Street Corporation’s SPY. The Chicago Mercantile Exchange (CME) offers futures contracts in the index and the Chicago Board of Options (CMOE) offers options as well as ETFs, inverse ETFs and leveraged ETFs.
Many different factors drive the S&P 500 but mainly it is the aggregate performance of the component companies revealed in their quarterly and annual company earnings reports. US and global macroeconomic data also contributes as it impacts on investor sentiment, which if positive drives gains. The level of interest rates, set by the Federal Reserve (Fed), also influences the S&P 500 as it affects the cost of credit, on which many corporations are heavily reliant. Therefore, inflation can be a major driver as well as other metrics which impact the Fed decisions.
Dutch Bros stock forecast
BROS stock was already trading below its 50-day Simple Moving Average (SMA) before earnings, which was a warning sign. Shares bounced off of support at $27 in the morning session, which is a good sign. If that level does not hold, then the $25.50 level from February should do the trick.
For now, the only goal for bulls is the 200-day SMA, which is sailing near $32. The downtrend will end once that barrier is overcome.
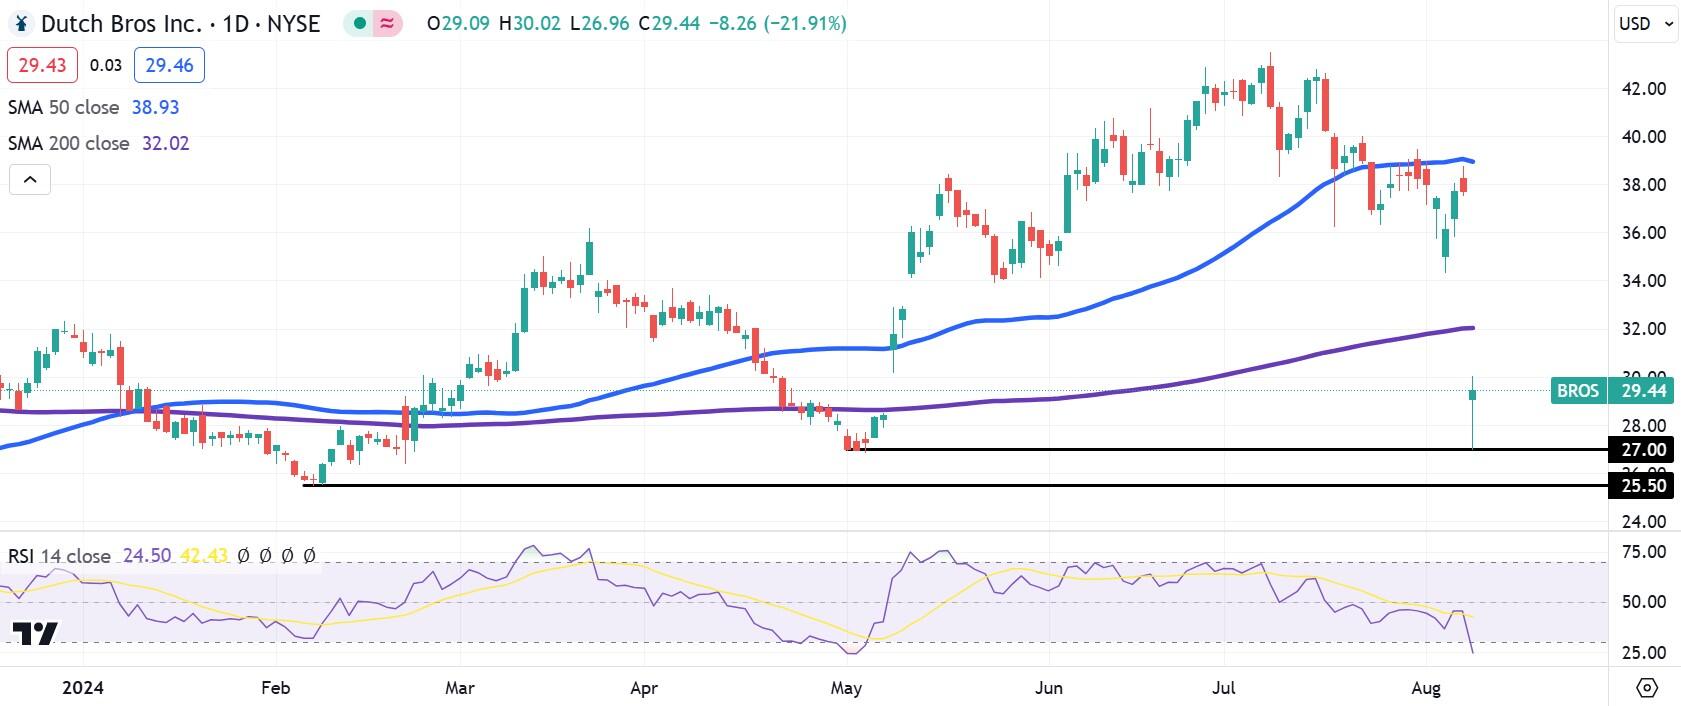
BROS daily stock chart
Premium
You have reached your limit of 3 free articles for this month.
Start your subscription and get access to all our original articles.
Author

Clay Webster
FXStreet
Clay Webster grew up in the US outside Buffalo, New York and Lancaster, Pennsylvania. He began investing after college following the 2008 financial crisis.


