Dow Jones Price Annual Forecast: Declining interest rates should keep stocks at all-time highs in 2024
- Dow Jones Industrial Average reached all-time high in December 2023, up more than 12% YTD, while S&P 500, NASDAQ Composite add 23% and 42%, respectively.
- DJIA reached an annual low of 31,429 on March 15, 2023, but made a YTD high of 37,347 on December 15.
- Expectations for 2024 rely on the Federal Reserve cutting interest rates by a minimum of 75 basis points, ushering in higher asset prices.

The Dow Jones Industrial Average (DJIA) had a whirlwind 2023 as both March and October witnessed major sell-offs, but the year is ending with the index garnering a new all-time high. The Santa rally has definitely arrived for the blue chip index as the year winds down, but expectations of a steady bevy of interest rate cuts by the Federal Reserve (Fed) have markets projecting more index highs well into 2024 as well.
What happened in 2023?
DJIA began the year still rebounding off the cycle lows of October 2022. That short rally found a top in February 2023 before falling prey to the twin headwinds of continued Fed rate hikes and the belief that a recession was bound to hit the US economy.
Furthermore, the 2023 banking crisis emerged in March and saw the collapse of Silicon Valley Bank, Signature Bank and First Republic Bank – all in a matter of weeks. The higher interest rate environment led these banks’ low-yield US Treasury portfolios to decline sharply in value, which in turn engendered a flood of depositor withdrawals.
The same bears that were proven correct in 2022’s large-scale market correction once again seemed like oracles when the Dow Jones sank to its lowest level of the year on March 15 at 31,429.
From there, the market rallied through early August as US economic indicators continued to outperform the dour outlook and the banking crisis subsided. Additionally, rumors emerged that the US central bank was nearing its terminal rate in the steepest rate hike cycle in decades.
That final rate hike came on July 26, when the Fed raised the fed funds rate by 25 basis points to 5.25% - 5.50%. The following three Federal Open Market Committee (FOMC) meetings would hold onto this rate regime in what Fed Chair Jerome Powell would term the “higher for longer” policy.
That phrasing from Powell led the market to sell off, beginning in late July. The sell-off then turned into a correction lasting three months when the Dow Jones suffered a greater than 10% pullback.
That correction ended on October 27 at a low of 32,427, which was a higher low than the March 15 low. In fact, one can argue that the Dow Jones has been in a mid-term uptrend since October 2022, although its long-term uptrend emerged in December with new all-time highs above 37,000.
In late November, the Dow Jones broke out of its latest correction at the fastest rate in 50 years, according to Deutsche Bank. While the sell-off lasted about three months, the turnaround took place in less than five weeks.
The FOMC meeting on December 13 then led to a rally across the US stock market as Fed Chair Powell admitted that interest rate cuts were finally on the table for 2024. Through December 15, the Dow has gained for seven consecutive weeks. This is the longest streak of weekly gains since the 9-week rally in December 2018 through February 2019.
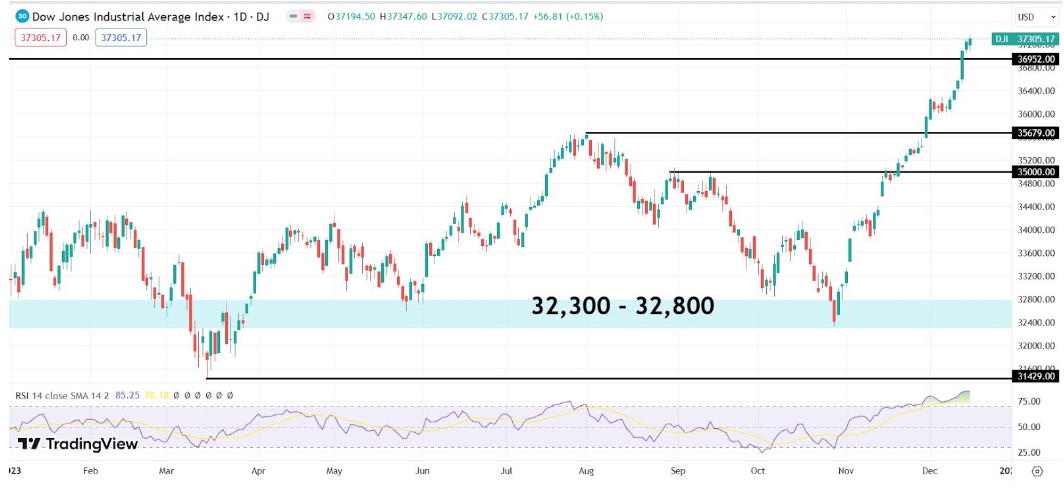
DJIA YTD (daily) chart
2024 Dow Jones fundamental outlook
With inflation cratering from mid-2022 through the end of 2023, the primary focus of the market heading into 2024 is when and how much the Fed will lower interest rates. Lower interest rates should give most companies more fiscal room for growth and acquisitions by reducing their cost of capital.
Goldman Sachs had already predicted earlier in the autumn that the Fed would launch its first rate cut of this cycle in May 2024. Since the Fed released its dot plot of future fed funds predictions on December 13, however, the market is now projecting the first rate cut at the March FOMC meeting.
Based on current projections from the CME Group’s FedWatch Tool, there is only a 10% chance of a rate cut at the January FOMC meeting. The prediction of a rate cut at the March meeting rises to above 70% though. Only 3% of bets think the fed funds rate will remain pinned at the current range (5.25% to 5.50%) at the May meeting.
The most recent Fed dot plot, which allows Fed governors to predict future fed funds rates at various points in the future, cut the average prediction for the end of 2024 at 4.6%. This was 50 basis points lower than the prediction in September 2023. Investors now expect at least 75 basis points of rate cuts in 2024.
Based on the rate bets housed in the FedWatch Tool, the most popular bet for year-end 2024 is a total of 150 basis points of cuts. This would reduce the fed funds rate to a range between 3.75% and 4%.
As the fed funds rate drops throughout 2024, US Treasury yields should decline as well. This should lead to many institutional investors swapping their fixed-rate investments for equities. This is yet another related tailwind for the Dow Jones index.
The index should benefit from the view that its status as a value index will be a good means of wading back into the stock market for many wary investors who sat out the stock market since 2022. However, tech and growth stocks – which are more heavily a focus of the S&P 500 and NASDAQ indices – may benefit more strongly from falling Treasury yields. That is because these stocks tend to be more dependent on lower interest rates to fund their growth strategies. Likewise, lower interest rates mean a lower discount rate for growth stocks that are reliant for their valuations on longer runways for future profitability.
Most Wall Street analysts and institutions are sticking to the proverbial “soft landing” outlook for 2024. This means that the US labor market and broad economy might soften a bit but both are likely to sidestep a true recession.
“While we continue to anticipate a choppy market environment given elevated headline risk, we believe the next couple of months will bring the beginning of a long rotation in equities that includes a move up in areas that have significantly lagged and areas that are well placed for a more substantive rally later next year,” wrote wealth management firm Merrill in a December investor note.
The primary dangers for the Dow Jones in 2024 will be a renewal in inflationary pressure or a major downturn in the earnings of component companies. Earnings have not been a major issue for index companies in late 2023, however, and most economists predict inflation continuing its measured drawdown toward the central bank’s 2% target.
2024 Dow Jones technical outlook
Since the Dow Jones soared above the January 5, 2022, all-time high on December 13, investors are expecting the index to fashion a more powerful high in 2024. The December 15 all-time high has reached 37,347. The primary threat at the moment, however, is that the Relative Strength Index (RSI) has already reached overbought conditions on both the daily and weekly charts (as shown below).
Overbought conditions simply mean that the RSI has reached the 70 level. This is what happens of course when an index rises for seven straight weeks. However, the stock market as a whole is in the midst of a Santa rally. December is typically one of the best-performing months for stocks historically as investors grow bullish ahead of a new year’s onset.
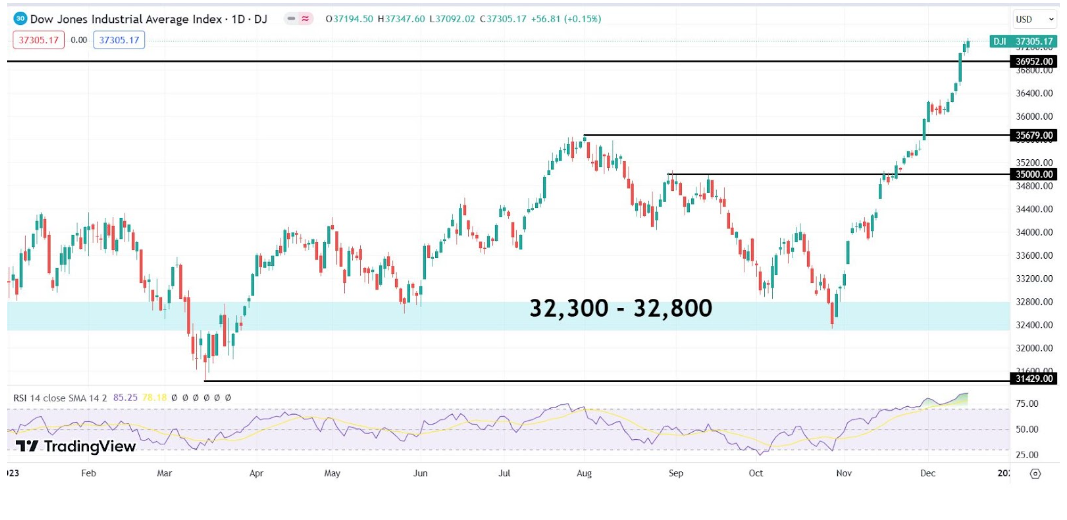
DJIA YTD daily chart
This means that traders should not expect the Dow Jones to simply sell off due to the overbought status. The most likely result for the last two weeks of the year is that the DJIA index continues the Santa rally through the new year.
At some point in early 2024, the index will most certainly need to consolidate. A good bet on the support level for that consolidation is the former all-time high at 36,952.
From there, slowing inflation and decent earnings growth should lead to further gains for the DJIA, and FXStreet expects the Dow Jones 2024 return to largely mirror the return for the S&P 500. Many large-cap stocks in both indices exploded in 2023, and both of the biggest indexes should experience more measured gains as more value-oriented stocks among their components lead the charge.
With Goldman Sachs giving a 5,100 year-end target for the S&P 500 in 2024, up 8%, our view of the market trends aligns largely with Goldman’s optimism. FXStreet thinks a similar performance by the Dow Jones will lead the DJIA index to end the year at 40,500.
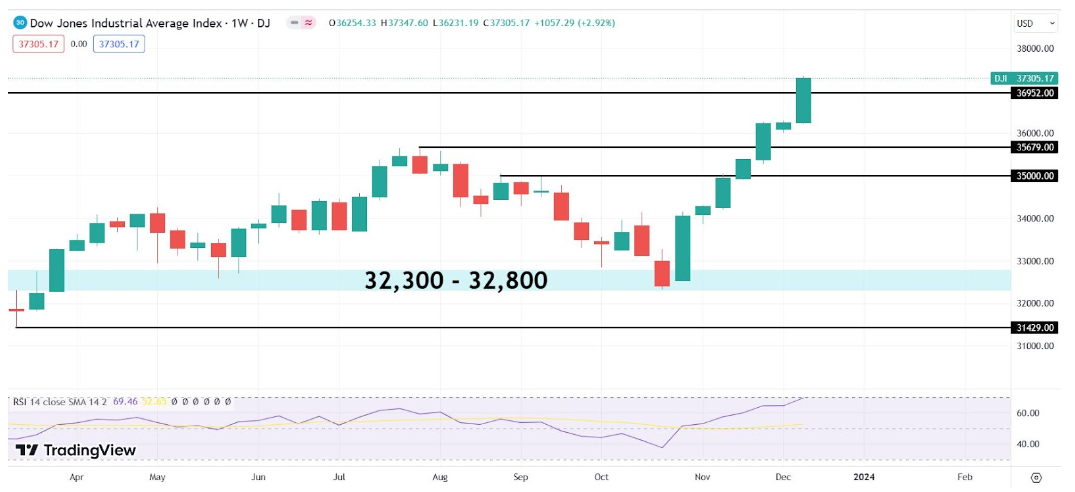
DJIA weekly chart
Summary
After reaching a new all-time high in December 2023, the Dow Jones index looks poised for further upside in 2024. The DJIA has witnessed its longest streak of weekly gains since February 2019, and this rally does not seem like a one-off event.
The Fed’s newfound willingness to talk about rate cuts and inflation’s continued edge lower despite a strong US economy appear to be a recipe for unmitigated bull market in 2024. The high-interest rate environment may push companies to delay growth projects until the second half of 2024, but there is little reason for pessimism overall.
The Fed dot plot released in December shows a largely hawkish central bank already predicting 75 basis points of interest rate cuts next year. The market, which has largely been accurate in calling the Fed’s bluff over the past year, expects 150 basis points of cuts. These cuts should engender euphoria among investors, who will stream back into the stock market after shifting toward bonds over the past two years.
This large influx of investment should buoy the Dow Jones as investors look for a safer path for reentry into the equity market. Lower interest rates will also lead to higher valuations for many stocks, which will also equate with a rising Dow Jones index.
Last of all, 2024 is a presidential election year for the United States. These years tend to see healthy gains in the stock market as governments tend to be more open to stimulus.
That is why FXStreet predicts a gain of 8% or more for the DJIA in 2024 and the index ending the year at 40,500.
Author

Clay Webster
FXStreet
Clay Webster grew up in the US outside Buffalo, New York and Lancaster, Pennsylvania. He began investing after college following the 2008 financial crisis.


