Dow Jones Industrial Average recovered nearly 700 points on Thursday
- Dow Jones climbed around 700 points on Thursday.
- US equities are attempting a recovery for the third time.
- Risk appetite is slowly rebuilding as investors pivot back to rate cut watch.

The Dow Jones Industrial Average (DJIA) recovered over 680 points during the Thursday market session after markets take another run at pushing equities back into a bullish trajectory following a near-term plunge fueled by fresh fears of a US recession. Market flows are beginning to return to normal, or some version of it, and indexes are taking another crack at recovering lost ground. However, the Dow Jones still remains on the wrong end of price action and scrambling to reclaim the 40,000.00 handle.
US Initial Jobless Claims for the week ended August 2 printed at 233K, less than the forecast 240K and easing back from the previous week’s 250K. Cooling initial unemployment figures are helping investors keep a lid on recent downturn fears after last week’s US labor data dump sparked a firm risk-off bid.
US data watchers will be on the lookout for a fresh round of producer and consumer-level inflation figures due next week. US Producer Price Index (PPI) inflation is slated for next Tuesday, with Consumer Price Index (CPI) inflation on the books for next Wednesday.
Dow Jones news
The Dow Jones tilted firmly into the high side, with nearly all of the index’s listed securities in the green on Thursday. Walt Disney Co. (DIS) ended Thursday flat just below $86.00 per share after reporting weaker-than-expected profits from theme park operations despite an upswing in revenue streaming services.
Intel Corp. (INTC) is in recovery mode on Thursday, rising nearly 8% and approaching $20.50 per share after hitting a fresh 52-week low early in the day. The tech giant is seeing a bounce in its share price after investors were spooked by a slight miss in Q2 earnings and a downside revision to Intel’s forward guidance for Q3.
Dow Jones price forecast
The Dow Jones has reclaimed the 39,000.00 handle in another intraday bid to spark fresh topside momentum, and bidders will be hoping that the third time’s the charm after repeated failures to make meaningful headway this week. The index has avoided falling back below the 38,500.00 level after its latest three-day plunge that dragged the equity board down -6.58% top-to-bottom, and bulls remain determined to keep the Dow Jones trading above the 200-day Exponential Moving Average (EMA) at 38,011.45.
Dow Jones daily chart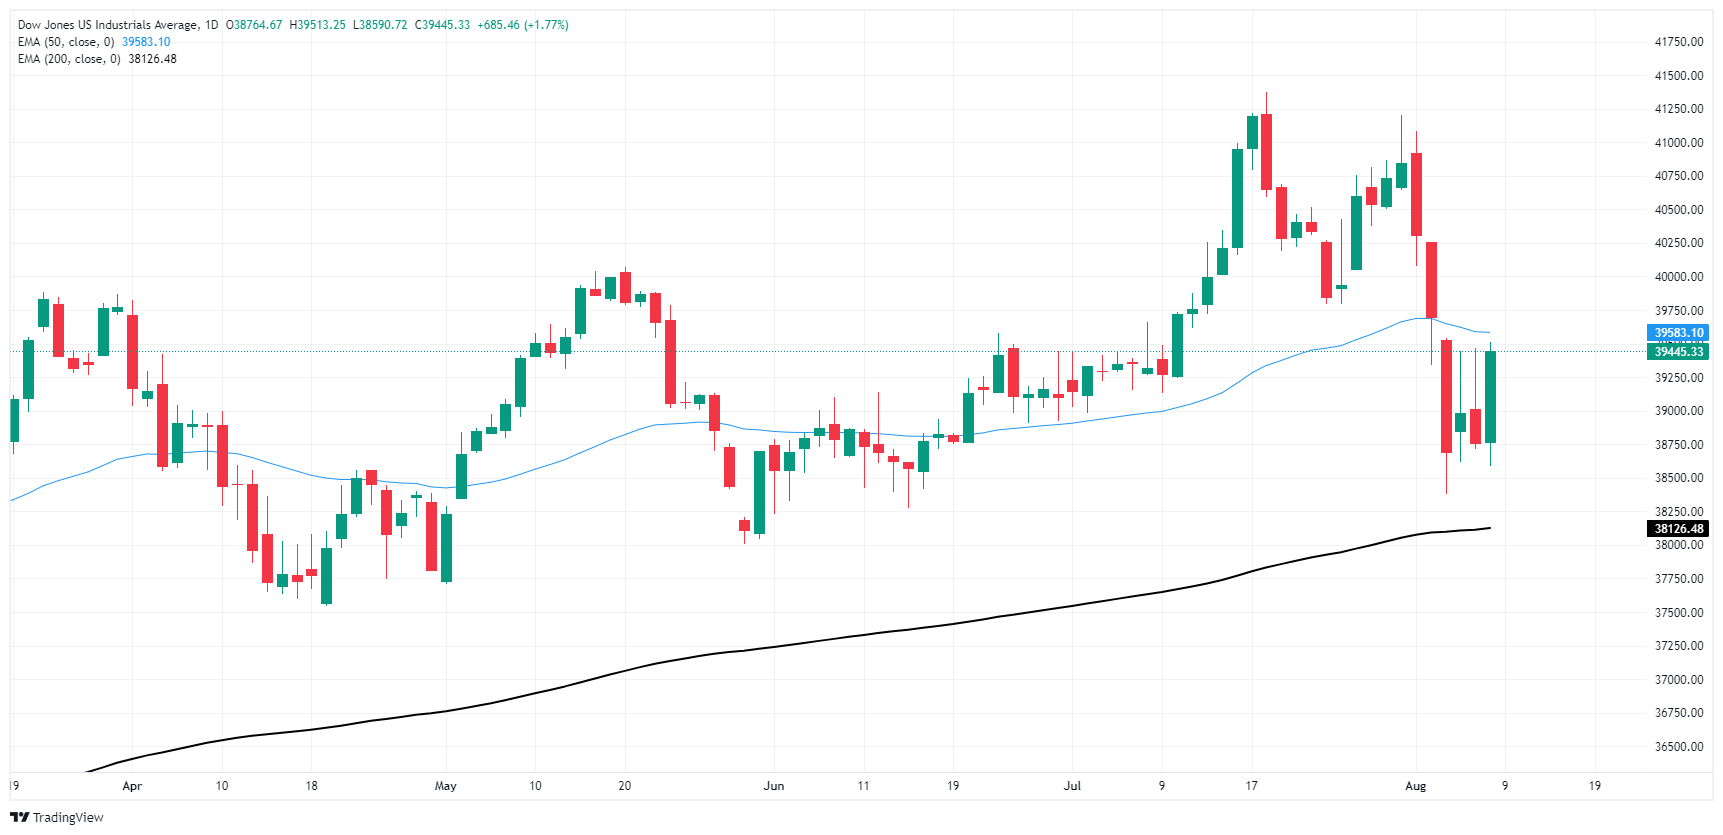
Dow Jones FAQs
The Dow Jones Industrial Average, one of the oldest stock market indices in the world, is compiled of the 30 most traded stocks in the US. The index is price-weighted rather than weighted by capitalization. It is calculated by summing the prices of the constituent stocks and dividing them by a factor, currently 0.152. The index was founded by Charles Dow, who also founded the Wall Street Journal. In later years it has been criticized for not being broadly representative enough because it only tracks 30 conglomerates, unlike broader indices such as the S&P 500.
Many different factors drive the Dow Jones Industrial Average (DJIA). The aggregate performance of the component companies revealed in quarterly company earnings reports is the main one. US and global macroeconomic data also contributes as it impacts on investor sentiment. The level of interest rates, set by the Federal Reserve (Fed), also influences the DJIA as it affects the cost of credit, on which many corporations are heavily reliant. Therefore, inflation can be a major driver as well as other metrics which impact the Fed decisions.
Dow Theory is a method for identifying the primary trend of the stock market developed by Charles Dow. A key step is to compare the direction of the Dow Jones Industrial Average (DJIA) and the Dow Jones Transportation Average (DJTA) and only follow trends where both are moving in the same direction. Volume is a confirmatory criteria. The theory uses elements of peak and trough analysis. Dow’s theory posits three trend phases: accumulation, when smart money starts buying or selling; public participation, when the wider public joins in; and distribution, when the smart money exits.
There are a number of ways to trade the DJIA. One is to use ETFs which allow investors to trade the DJIA as a single security, rather than having to buy shares in all 30 constituent companies. A leading example is the SPDR Dow Jones Industrial Average ETF (DIA). DJIA futures contracts enable traders to speculate on the future value of the index and Options provide the right, but not the obligation, to buy or sell the index at a predetermined price in the future. Mutual funds enable investors to buy a share of a diversified portfolio of DJIA stocks thus providing exposure to the overall index.
Author

Joshua Gibson
FXStreet
Joshua joins the FXStreet team as an Economics and Finance double major from Vancouver Island University with twelve years' experience as an independent trader focusing on technical analysis.


